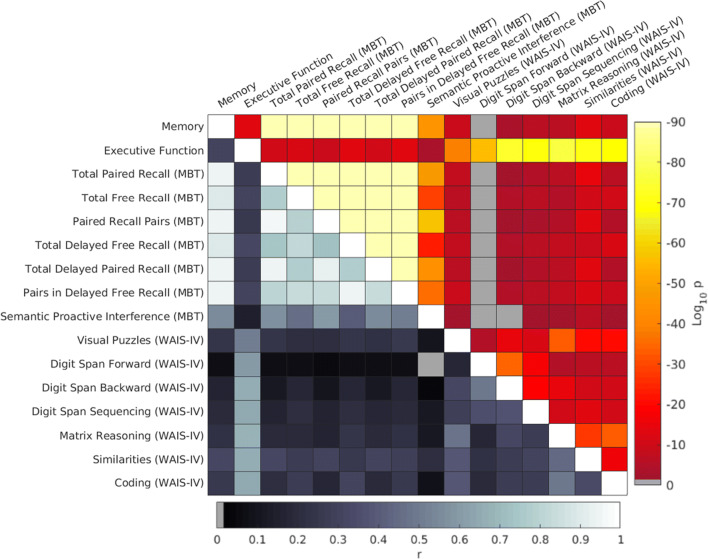
Fig. 2.
Cross-correlation matrix between pairs of the cognitive measures depicting results of Pearson’s correlations. The hot colour scale in the upper diagonal represents statistical significance (p-values), in which grey coloured regions depict non-significant correlations. Values down the main diagonal represent strength of correlation (r), which was always positive. The two cognitive domains were highly significant correlated with their respective cognitive measures. Memory measures were highly correlated among them, whereas executive function measures only showed a modest correlation among themselves but also with memory scores. Abbreviation: MBT, Memory Binding Test

