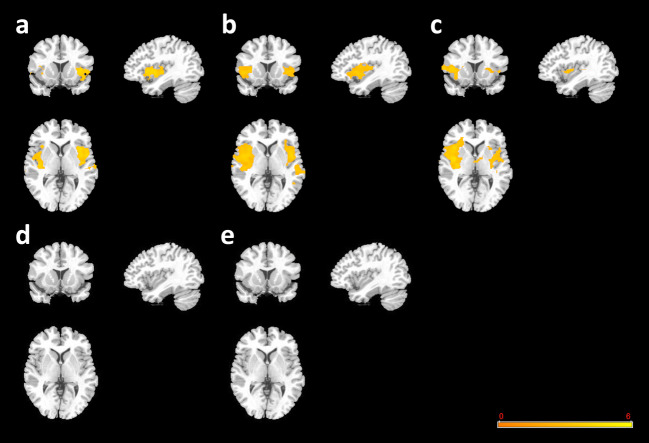
Fig. 1.
GMV baseline comparisons. a H-AVHs at baseline vs. HCs (genotype groups combined). b H-AVH COMP-Met group at baseline vs. HC COMT-Met group. c H-AVH COMP-Val group at baseline vs. HC COMT-Val group. d HC COMT-Met group vs. HC COMT-Val group. e H-AVH COMT-Met group at baseline vs. H-AVH COMT-Val group at baseline. Warm pseudocolor represents increased GMV in the former group relative to the second (reference) group

