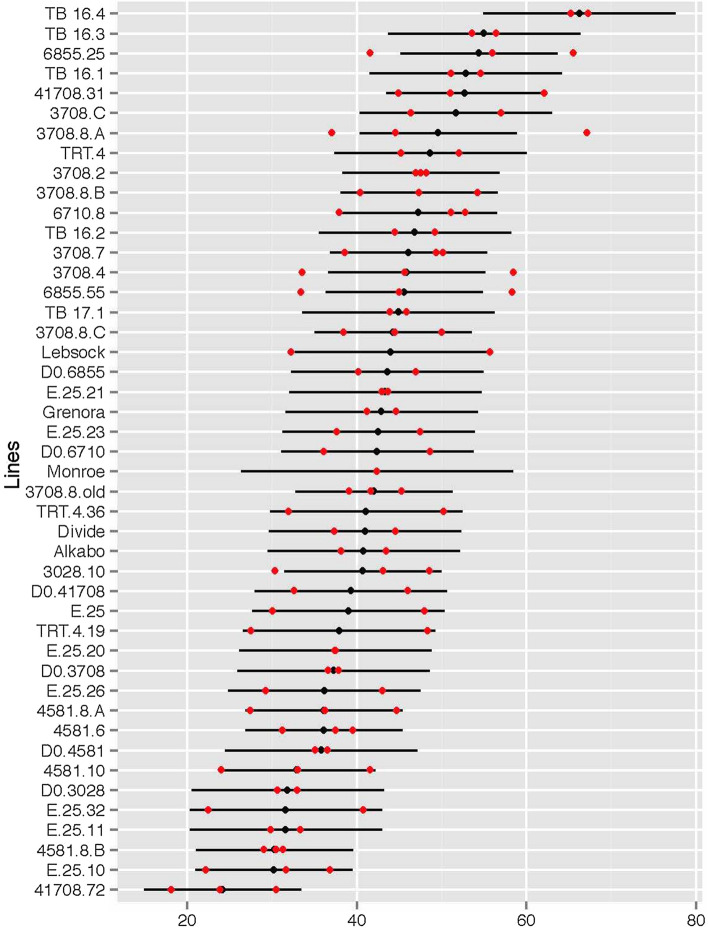
Figure 1.
ANOVA plot showing the Fusarium head blight (FHB) disease severity estimates with 95% confidence intervals as black lines and dots. The lines at top and bottom have highest and lowest severity, respectively. Red dots indicate 80% trimmed mean of visual scoring data of disease severity, collected during the summer 2015 field season at Saint Paul, MN. Each red dot indicates one replicate. One replicate is an 80% trimmed mean of scores from 20 spikes. X-axis shows disease severity percentage and Y-axis show the name of the lines tested during the study.

