Figure 1.
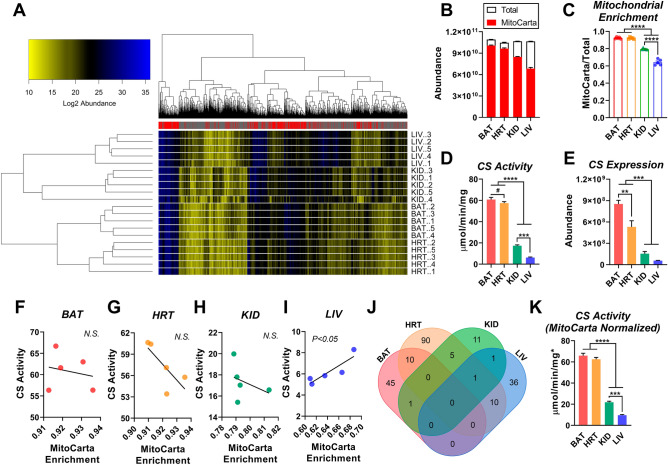
Quantification of percent mitochondrial enrichment using subcellular proteomics. (A) Heatmap displaying abundance (Log2) of mitochondrial and non-mitochondrial high confidence proteins from isolated mitochondria samples prepared from BAT, HRT, KID, and LIV. Mitochondrial proteins are indicated in the legend by a ‘red’ mark. Mitochondrial proteins were assigned using the MitoCarta 2.0 database. (B) Summed total abundance of all proteins, relative to mitochondrial proteins. (C) Mitochondrial enrichment factors per tissue, derived from the ratio of mitochondrial to total protein abundance. (D) Citrate synthase (CS) activity in isolated mitochondria, normalized to protein. (E) CS abundance. (F–J) Correlation between CS activity and MitoCarta enrichment. (J) Overlapping proteins per tissue that correlate with MitoCarta enrichment. (K) CS activity normalized to protein and corrected for each sample’s mitochondrial enrichment factor (MEF). To do this, CS activity displayed in panel (D) was multiplied by the sample-specific MEF. (A) Figure generated using R Studio version 3.6.2 (heatmap.plus). (B–I, K) Figures were generated using GraphPad Prism 8 software (Version 8.4.2) (J) Figure generated using https://bioinformatics.psb.ugent.be/webtools/Venn/. Data information: Data are presented as mean ± SEM, N = 5/group. **P < 0.01, ***P < 0.001, ****P < 0.0001, #P < 0.05 (Student’s t-test).

