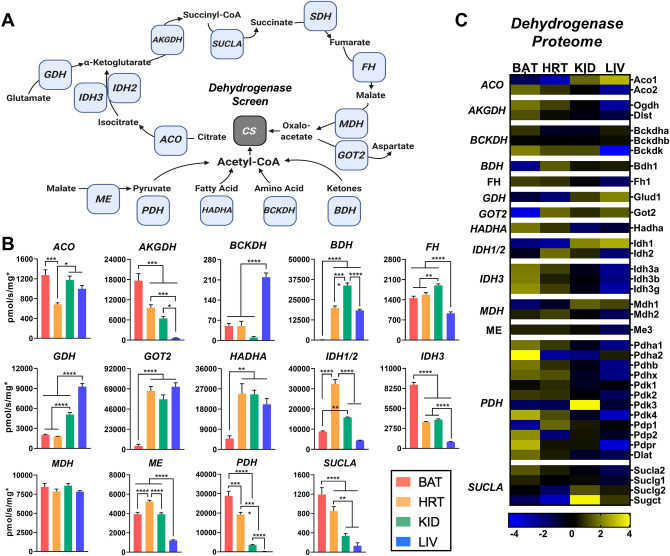
Figure 2.
Intrinsic differences in matrix dehydrogenase activity and expression across tissues. (A) Cartoon depicting the matrix dehydrogenases, and associated enzymes, network. (B) Enzyme activity normalized to total protein and corrected for each sample’s MEF. (C) MitoCarta 2.0 normalized protein expression of individual enzyme subunits. (A) Figure created with BioRender.com. (B,C) Figure generated using GraphPad Prism 8 software (Version 8.4.2). Data information: Data are presented as mean ± SEM, N = 5/group. *P < 0.05, **P < 0.01, ***P < 0.001, ****P < 0.0001.

