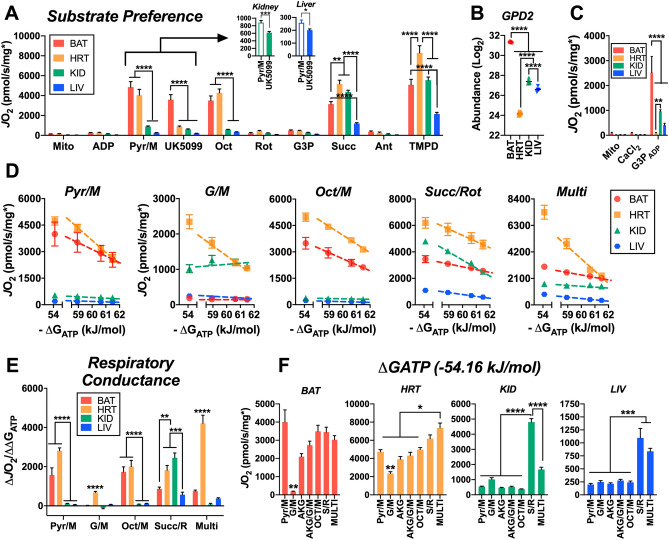
Figure 3.
Carbon substrate preference and OXPHOS conductance across tissues. (A) Mitochondrial respiratory flux (JO2) stimulated with 0.5 mM ADP, clamped throughout the experiment via the hexokinase clamp. Substrate and inhibitor additions were as follows: Pyr/M (1 mM/1 mM), UK5099 (pyruvate carrier inhibitor – 0.001 mM), Oct (0.2 mM), Rot (0.0005 mM), G3P (10 mM), Succ (10 mM), Ant (0.0005 mM), TMPD (0.5 mM, plus 2 mM ascorbate). (B) Glycerol-3-phosphate dehydrogenase 2 (GPD2) abundance. (C) Mitochondrial JO2 in the presence of CaCl2 (1.5 µM), stimulated by G3P (10 mM) and 0.5 mM ADP via the hexokinase clamp (G3PADP). (D) Relationship between JO2 and ATP free energy (ΔGATP) clamped with the CK clamp in mitochondria energized with Pyr/M, G/M, Oct/M, Succ/Rot, and Multi. (E) Respiratory conductance – slope of the relationship between JO2 and ΔGATP. (F) Maximal OXPHOS flux (JO2 at ΔGATP of − 54.16 kJ/mol) in response to various substrate combinations. Data information: (A,D,F) Data normalized to protein corrected for each sample’s MEF. (C) Data normalized to average MEF for that tissue. Figures generated using GraphPad Prism 8 software (Version 8.4.2) Data are Mean ± SEM, N = 5/group. *P < 0.05, **P < 0.01, ***P < 0.001, ****P < 0.0001.

