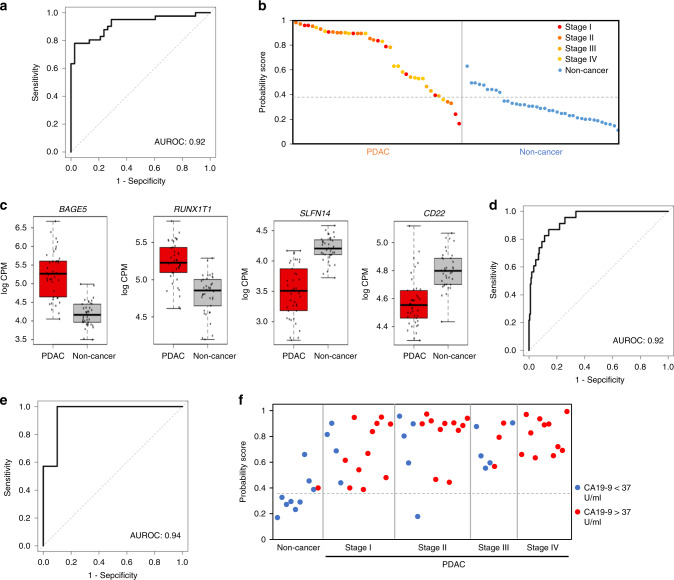
Fig. 4. Identification of a 5hmC signature that differentiates PDAC cfDNA from non-cancer samples.
a Predictive modeling using regularized regression model (elastic net) on the discovery dataset with 41 PDAC and 38 non-cancer cfDNA. b Probability scores derived for each sample in the discovery dataset using the elastic net. Probability scores towards 1 are predicted cancer samples whereas probability scores close to 0 are non-cancer samples. Dotted line denotes Q3 of the probability score of non-cancer samples. c 5hmC coverage (expressed in logCPM) over BAGE5, RUNX1T1, SLFN14 and CD22 in PDAC (n = 41) and non-cancer (n = 38) cfDNA cohorts as example of top selected model features. For all boxplots, center line represents median, bounds of box represent 25th and 75th percentiles and whiskers extend to minimum or maximum values. Each dot represents an individual cfDNA sample. d, e ROC curves for independent validation cohorts of 23 PDAC cfDNA and 205 non-cancer cfDNA processed internally (d) and 7 PDAC cfDNA and 10 non-cancer cfDNA from Song et al. (e). f Predicted probability scores for non-cancer (n = 10), and Stage I (n = 15), Stage II (n = 16), Stage III (n = 8) and Stage IV (n = 11). Same samples were also analyzed for CA19-9 levels. Samples within the clinically defined normal range (0–37 U/ml) are denoted in blue, and samples that are above are denoted in red.

