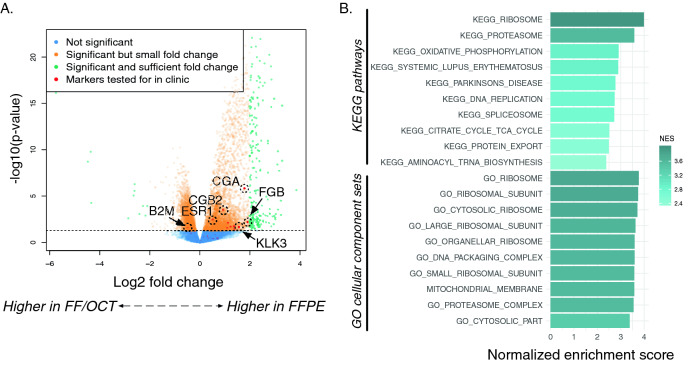
Figure 4.
Comparison of transcriptional profiles of FFPE—FF/OCT replicates. (A) A volcano plot of results for the linear model fit using weighted least squares for each gene performed on FFPE vs. FF/OCT expression is shown wherein the dashed line indicates an adjusted p-value = 0.05. Green points are genes that are differential for at least a log2 fold change of 2 and are significant after p-value adjustment. Genes for targeted clinical genomic tests (NCI tumor markers list) are shown in red. Several genes have been labeled to provide more insight into which genes are being represented. These labeled genes include those coding for the α subunit of glycoprotein hormones (CGA), beta-2-microglobulin (B2M), chorionic gonadotropin beta-subunit 2 (CGB2), fibrogen B beta chain (FGB), estrogen receptor 1 (ESR1), and kallikrein related peptidase 3 (KLK3). This scatter plot shows that none of these clinically important genes are differential between FFPE and FF/OCT replicates at statistically significant levels. (B) GSEA-based pathway enrichments of the differential expression analysis of FFPE vs. FF/OCT cohorts. All pathways listed here are up in FF samples. No statistically significant pathways were found up-regulated in FFPE samples.

