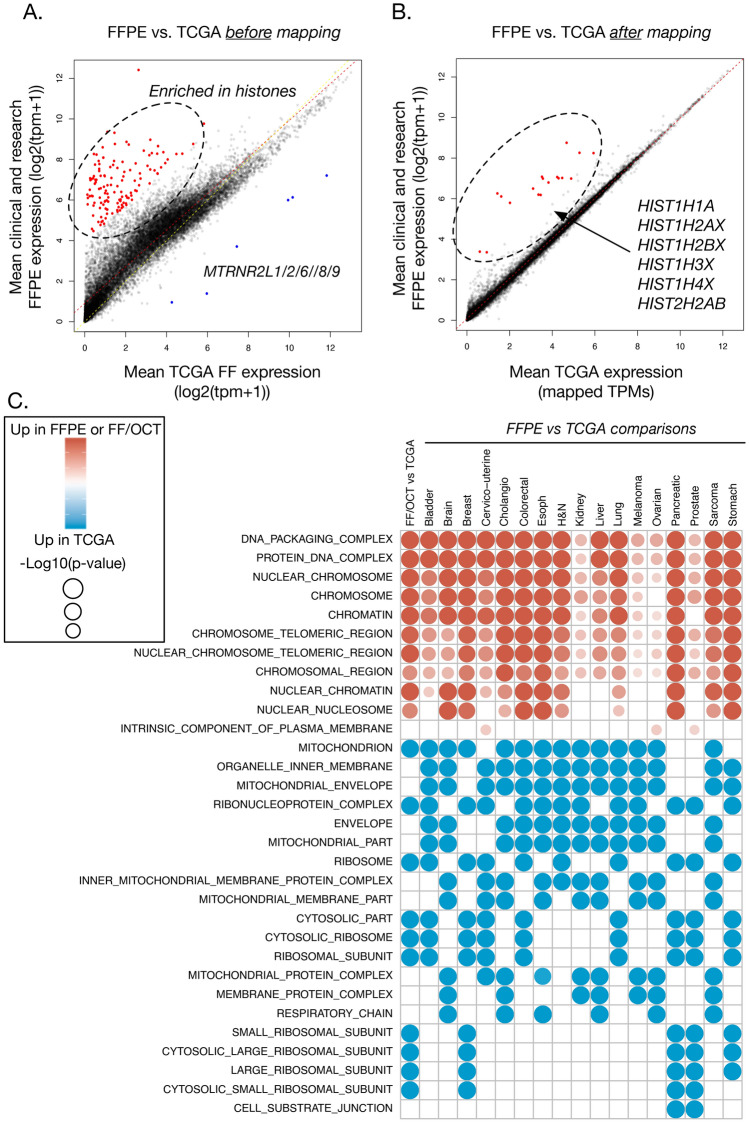
Figure 6.
Comparison of transcriptional profiles of the FFPE cohort compared to TCGA samples. Per-gene mean expression comparison between our FFPE and TCGA cohorts before (A) and after (B) the mapping of TCGA into FFPE RNA-Seq space is shown. (C) Pathway MSigDB enrichments for each of the cancer type, as well as FF/OCT samples, vs. TCGA of matched cancer type were computed using top differential genes; enrichment strength is based on FWER p-value.

