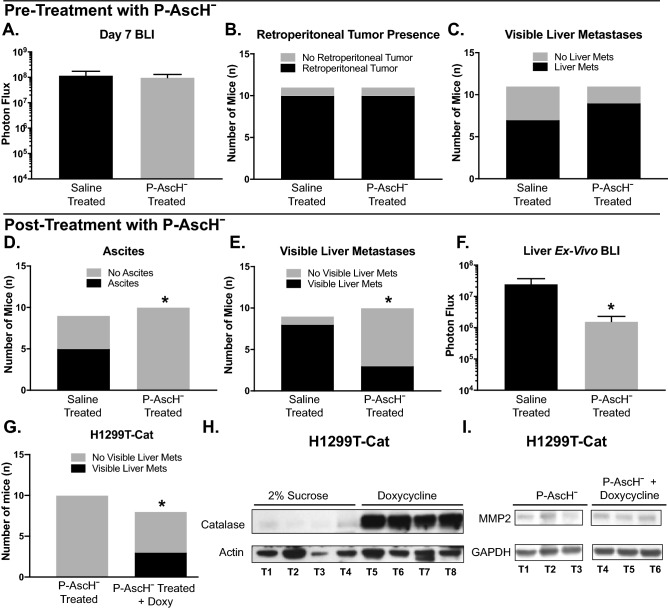
Figure 4.
P-AscH− decreases the metastatic potential of PDAC in vivo. MIA PaCa-2-Luc-GFP or H1299T-Cat (2 × 10⁶) cells were injected into the spleen and a splenectomy was performed. One set of mice were pre-treated with I.P. P-AscH− (4 g/kg) or saline (1 M) twice a day for two days prior to splenic injection, the other set of mice were treated with P-AscH− or saline twice a day starting 2 days following splenic injection. Tumor formation was followed for a total of 30 days. (A) Bioluminescence imaging 7 days following tumor cell injection showed no difference in photon flux between saline treated mice and mice treated with P-AscH−. Data represent the mean photon flux compared to controls ± SE (n = 5, p > 0.05; Two-tailed unpaired Student’s t test). (B) P-AscH− treated mice were found to have a no statistically different chance of forming retroperitoneal tumors compared to saline treated mice. Data are represented in a Two-tailed contingency table (n = 11, p > 0.05; Fisher’s exact test). (C) P-AscH− treated mice were found to have a no statistically different chance of forming visible liver metastases compared to saline treated mice. Data are represented in a Two-tailed contingency table (n = 11, p > 0.05; Fisher’s exact test). (D) Saline treated mice were found to have a greater incidence of developing ascites compared to P-AscH− treated mice. Data are represented in a Two-tailed contingency table (n = 9–10, *p < 0.05; Fisher’s exact test). (E) Saline treated mice were found to have a statistically greater chance of visible liver metastases compared to P-AscH− treated mice. Data are represented in a Two-tailed contingency table (n = 9–10, *p < 0.05; Fisher’s exact test). (F) A significant decrease was seen in ex-vivo bioluminescence of livers in saline treated mice compared to P-AscH− treated mice. Data represent the mean photon flux compared to controls ± SE (n = 9–10, *p < 0.05; Two-tailed unpaired Student’s t-test). (G) Mice injected with H1299T-CAT cells were treated with control (2% sucrose) or doxycycline (2 mg/mL and 2% sucrose) in drinking water (changed every 2–3 d). Data are represented in a Two-tailed contingency table (n = 8–10, *p < 0.05; Chi-square test). (H) Catalase immunoreactive protein is increased in tumors from mice treated with P-AscH− + doxycycline in their drinking water compared to mice treated with P-AscH−. Tumors were excised and western blotting was performed. Actin was used as a loading control. (Representative blots shown, n = 3). Original unprocessed blots can be found in Supplementary Fig. S3. (I) MMP-2 immunoreactive protein is decreased in mice treated with P-AscH− compared to mice treated with P-AscH− + doxycycline in their drinking water. Tumors were excised and western blotting was performed. GAPDH was used as a loading control. (Representative blots shown, n = 3). Original unprocessed blots can be found in Supplementary Fig. S3.

