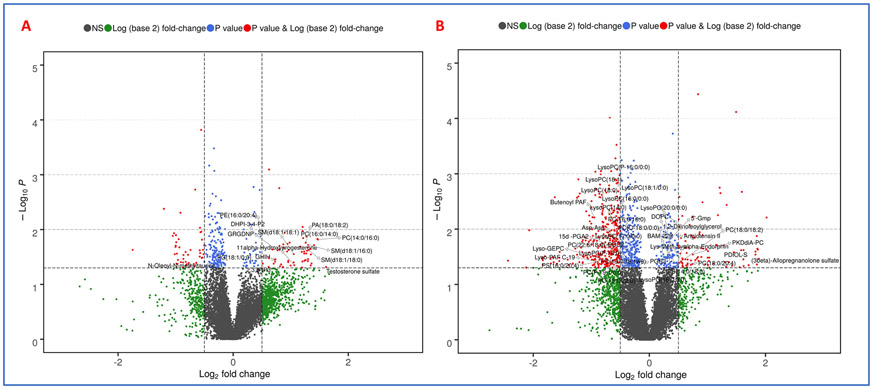
Figure 6.
A. Volcano plot showing comparison of patient plasma profiles at two weeks post-RT (T2). B. Volcano plot showing comparison of patient plasma profiles at 3-5 months post-RT (T3). All metabolites have a significant p-value (< 0.05) comparing patients with cardiac toxicity versus no toxicity and were annotated by tandem mass spectrometry.

