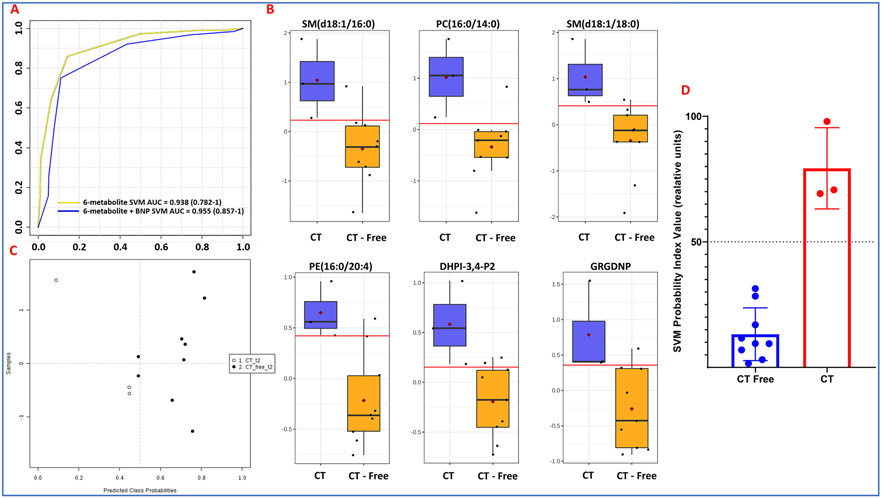
Figure 8.
Biomarker panel predictive of radiation induced cardiac toxicity 2 weeks post-RT. Panel A. ROC curve of a six-metabolite biomarker SVM panel with AUC = 0.938 (0.782-1); six-metabolite plus BNP biomarker SVM panel with AUC = 0.955 (0.857-1). Panel B. Uncertainty matrix showing distribution of patients based on the biomarker pane. Panel C. Pattern of abundance for the six-metabolite panel in patients who developed cardiac toxicity as compared to those who did not. Panel D. The linear SVM model that distinguishes the two patient groups.

