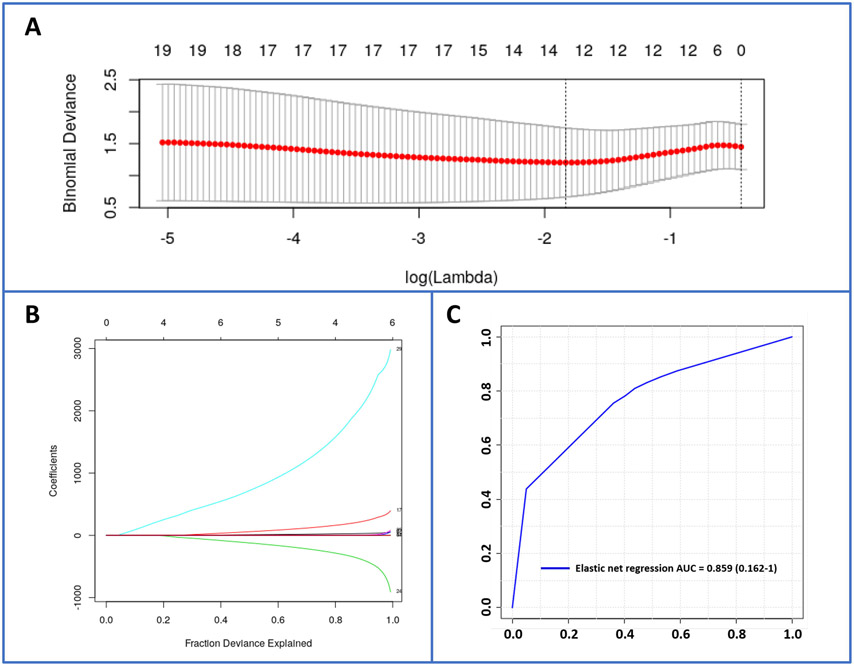
Figure 9.
Elastic net regression for evaluation of biomarker performance. Panel A. Cross-validation curve (red dotted line) and corresponding upper and lower SD curves along the λ sequence (error bars). Selected λs are indicated by the vertical dotted lines. Panel B. Percent deviance explained on the dataset: Variable path of each coefficient against the fraction deviance explained. Panel C. ROC curve of an elastic net regression selected 12-metabolite biomarker panel with AUC = 0.859 (0.162-1).

