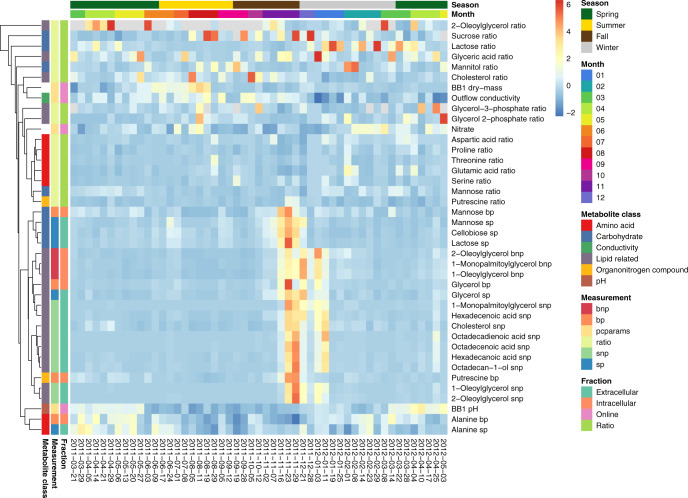
Fig. 4. Levels of metabolites and physico-chemical parameters.
Z-score transformed metabolite intensities, metabolite ratios, and physico-chemical parameter levels over time are shown. Row annotations highlight classes of metabolites and parameters, measurement types (bnp: intracellular nonpolar metabolites, bp: intracellular polar m., pcparams: physico-chemical parameters, ratio: metabolite intrac./extrac. ratio, snp: extracellular nonpolar m., sp: extracellular polar m.), and the subtype or fraction of the measurement (manual: measured during sampling, online: measured during WWTP operation). Selected rows are shown (comprehensive heatmap shown in Supplementary Fig. 6). Source data are provided as a Source Data file.

