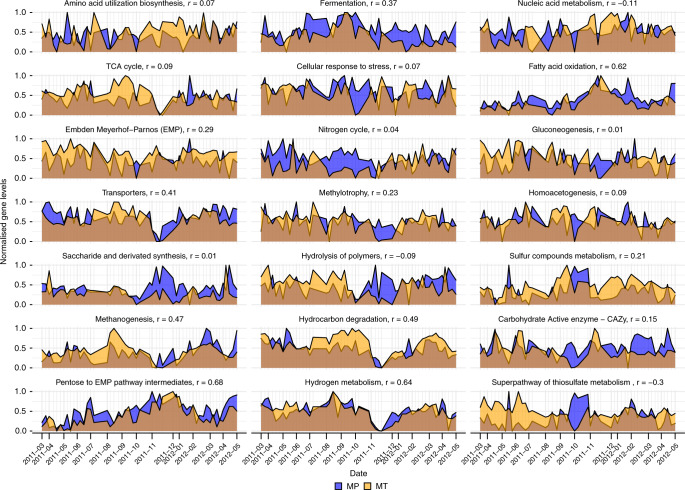
Fig. 5. Gene levels over time grouped by functional categories.
Metatranscriptomic and metaproteomic levels (normalized relative expression for MT data and normalized relative spectral counts for MP data) of rMAG-derived genes assigned to FOAM ontology-based functional categories. Pearson correlation coefficients (r) of MT and MP values are shown in the title of each panel. Panels are ordered from highest to lowest mean MP relative count in row-major order. Source data are provided as a Source Data file.

