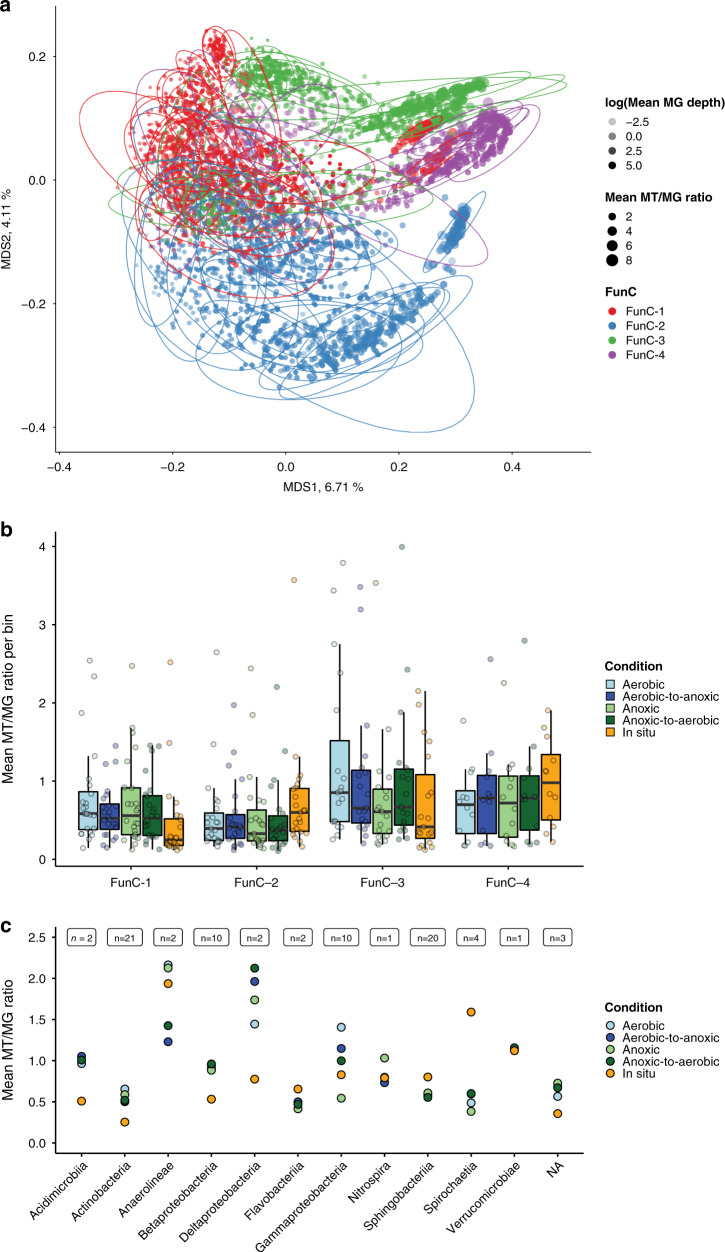
Fig. 6. Realized niches.
a MDS of time-point specific expression profiles based on MT/MG ratios or evidence at the MP level. Colors indicate FunC assignment of the individual rMAGs. Point shape represents cluster assignment based on automated clustering of the embedded points. Ellipses containing 95% of cluster-assigned data points are shown. Points size represents the average MT/MG depth ratios of the individual rMAGs. The amounts of variance explained by the first two dimensions are shown on the respective axes. b Mean MT/MG depth ratios over all time-points are shown per condition for 78 rMAGs (boxplots show: center line, median; box limits, upper and lower quartiles; whiskers, 1.5× interquartile range; Each group of boxplots corresponds to a group of rMAGs (FunC-1 n = 24, FunC-2 n = 23, FunC-3 n = 19, FunC-4 n = 12), each boxplot represents an independent experiment.). c Mean MT/MG depth ratios grouped according to class-level taxonomic assignment of the rMAGs with the number of rMAGs for each group are shown in the top of the plot (n). Source data are provided as a Source Data file.

