
Figure 1.
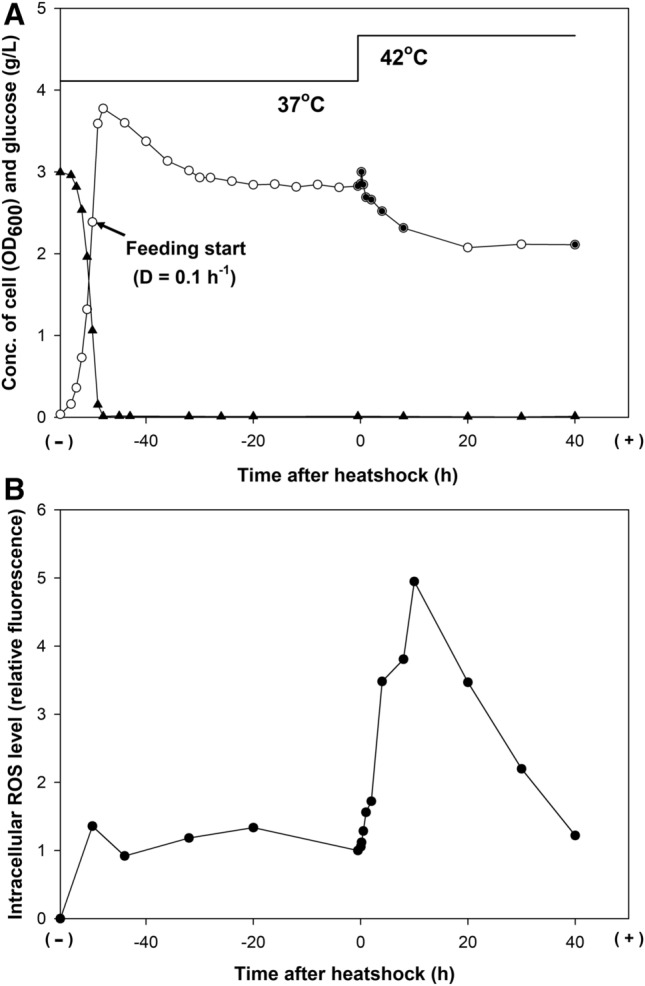
Chemostat culture of E. coli BL21(DE3) under heatshock stress. (A) Time profiles of the cell density (open circle) and glucose concentration in the culture media (filled triangle). The filled circles indicate the sampling points for transcriptome and proteome analyses, which were done 30 min before the temperature increase (from 37 to 42 °C) and after 2 min, 10 min, 30 min, 1 h, 2 h, 4 h, 8 h, and 40 h. (B) Time profiles of the intracellular reactive oxygen species (ROS) level.