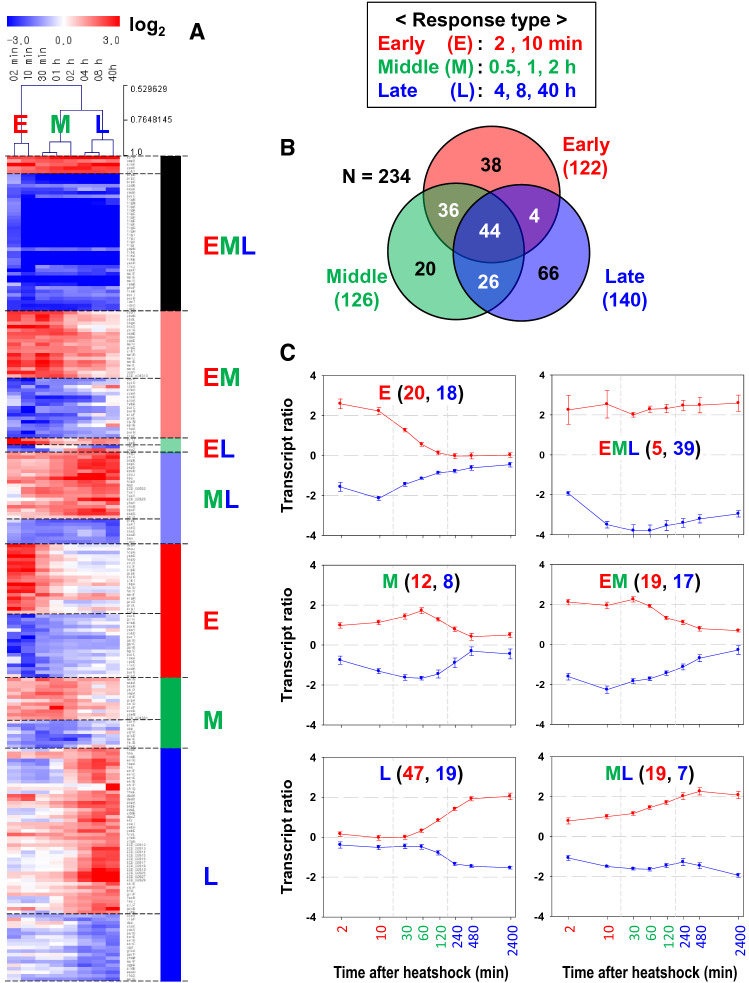
Figure 2.
Genes differentially expressed at the early, middle, and late periods of the upshifted temperature. The mRNA log2 ratios of time-series data were normalized to a sample from pre-perturbation (30 min before the temperature upshift). (A) Heatmap of the transcript ratios grouped according to time stages with member genes in rows and sampling time points in columns. Clustering of the sampling time points is shown above the heat map for the early (E), middle (M), and late (L) stages. The image was created with MeV software (version 4.9.0, https://mev.tm4.org). (B) Venn diagram of the differentially expressed genes (DEGs) identified in the different time stages. (C) Time profiles of averaged transcript ratios of the DEGs according to the time stage. The X-axis denotes the culture time after the temperature upshift (min in log scale), and the Y axis denotes the log2-transformed transcript ratio in reference to the mRNA intensity at 30 min before the perturbation. The error bar denotes the standard error of the mean from the member genes. In each plot, the numbers of upregulated and downregulated genes are depicted in red and blue, respectively.

