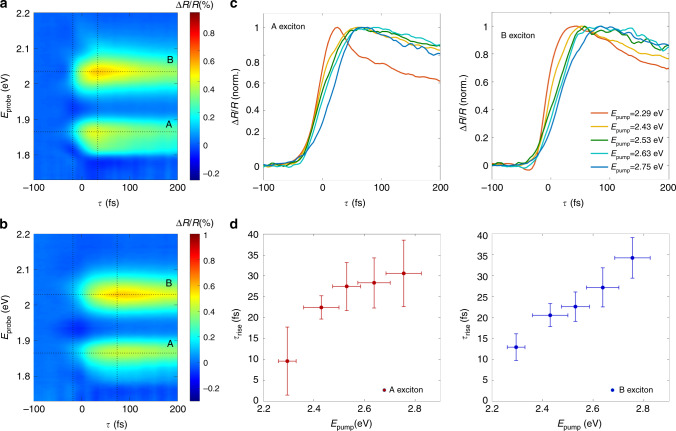
Fig. 2. Energy-dependent exciton formation process.
ΔR/R maps measured on 1L-MoS2 photoexcited a at 2.29 eV and b at 2.75 eV. The measurements are performed at room temperature. The horizontal dashed lines pass through the maximum of the ΔR/R spectrum at the energies of the A1s/B1s exciton transitions, while the vertical lines mark the temporal range from 10 to 90% of the build-up signal. The excitation fluence is 5 μJcm−2. Pump and probe beams have parallel and linear polarizations. The time zero is defined, for each measurement, as the maximum of the cross-correlation signal between the pump and the probe pulses as explained in the Methods. c Temporal cuts of the ΔR/R maps measured across the A1s and B1s excitonic resonances for increasing pump photon energy. d Pump photon energy dependence of τrise. Horizontal error bars are determined by the bandwidth of the pump pulses; vertical error bars are obtained from the fits of the time traces.

