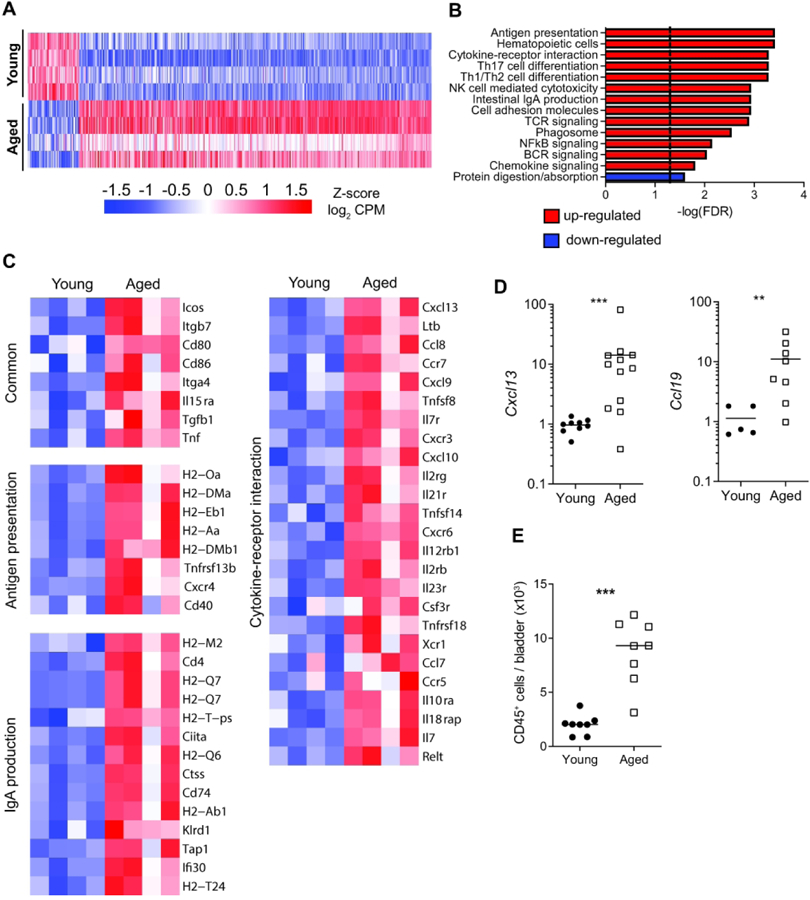
Figure 1. Tissue transcriptomic map of young and aged bladders.

(A) Heatmap of the global tissue transcriptome of young and aged bladders with fold change >2 and Benjamini-Hochberg FDR-adjusted P<0.05. n= 4 bladders/group. (B) Significantly enriched KEGG pathways based on fold change of all genes. (C) Heatmaps of significantly different genes from select significant KEGG pathways. (D) Gene expression validation by qRT-PCR in whole bladders (n=5–11/group). (E) Number of CD45+ cells/bladders from young and aged mice (n=8/group) determined by flow cytometry. Line at median. ***p<0.001, **p<0.01, Mann-Whitney U-test.
