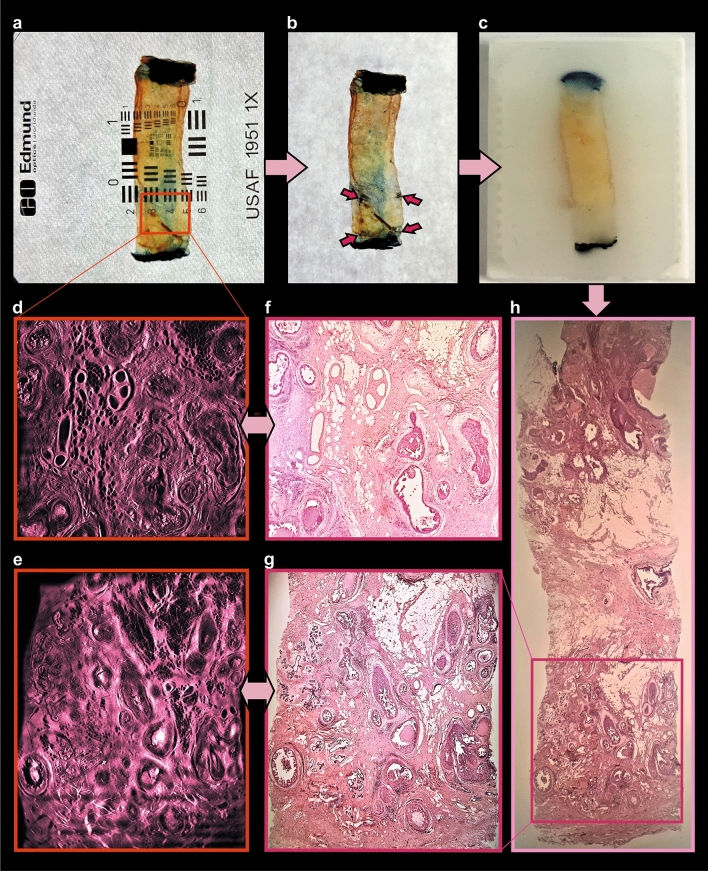
Figure 5.
Post-processing of cleared specimen with standard histology methods. Comparison of obtained images. (a) Cleared specimen. (b) 4-dots labelling (red arrows) of the optical “area of interest”, found within the UM-recording. (c) Same sample, embedded in paraffin. (d,e) Optical sections of 3D-reconstruction of the specimen (see movie to Fig. 5d in Supplementary material), corresponding to (f,g) H&E-stained histological sections (× 2 magnification). (h) Whole-specimen cut with microtome and stained with H&E.

