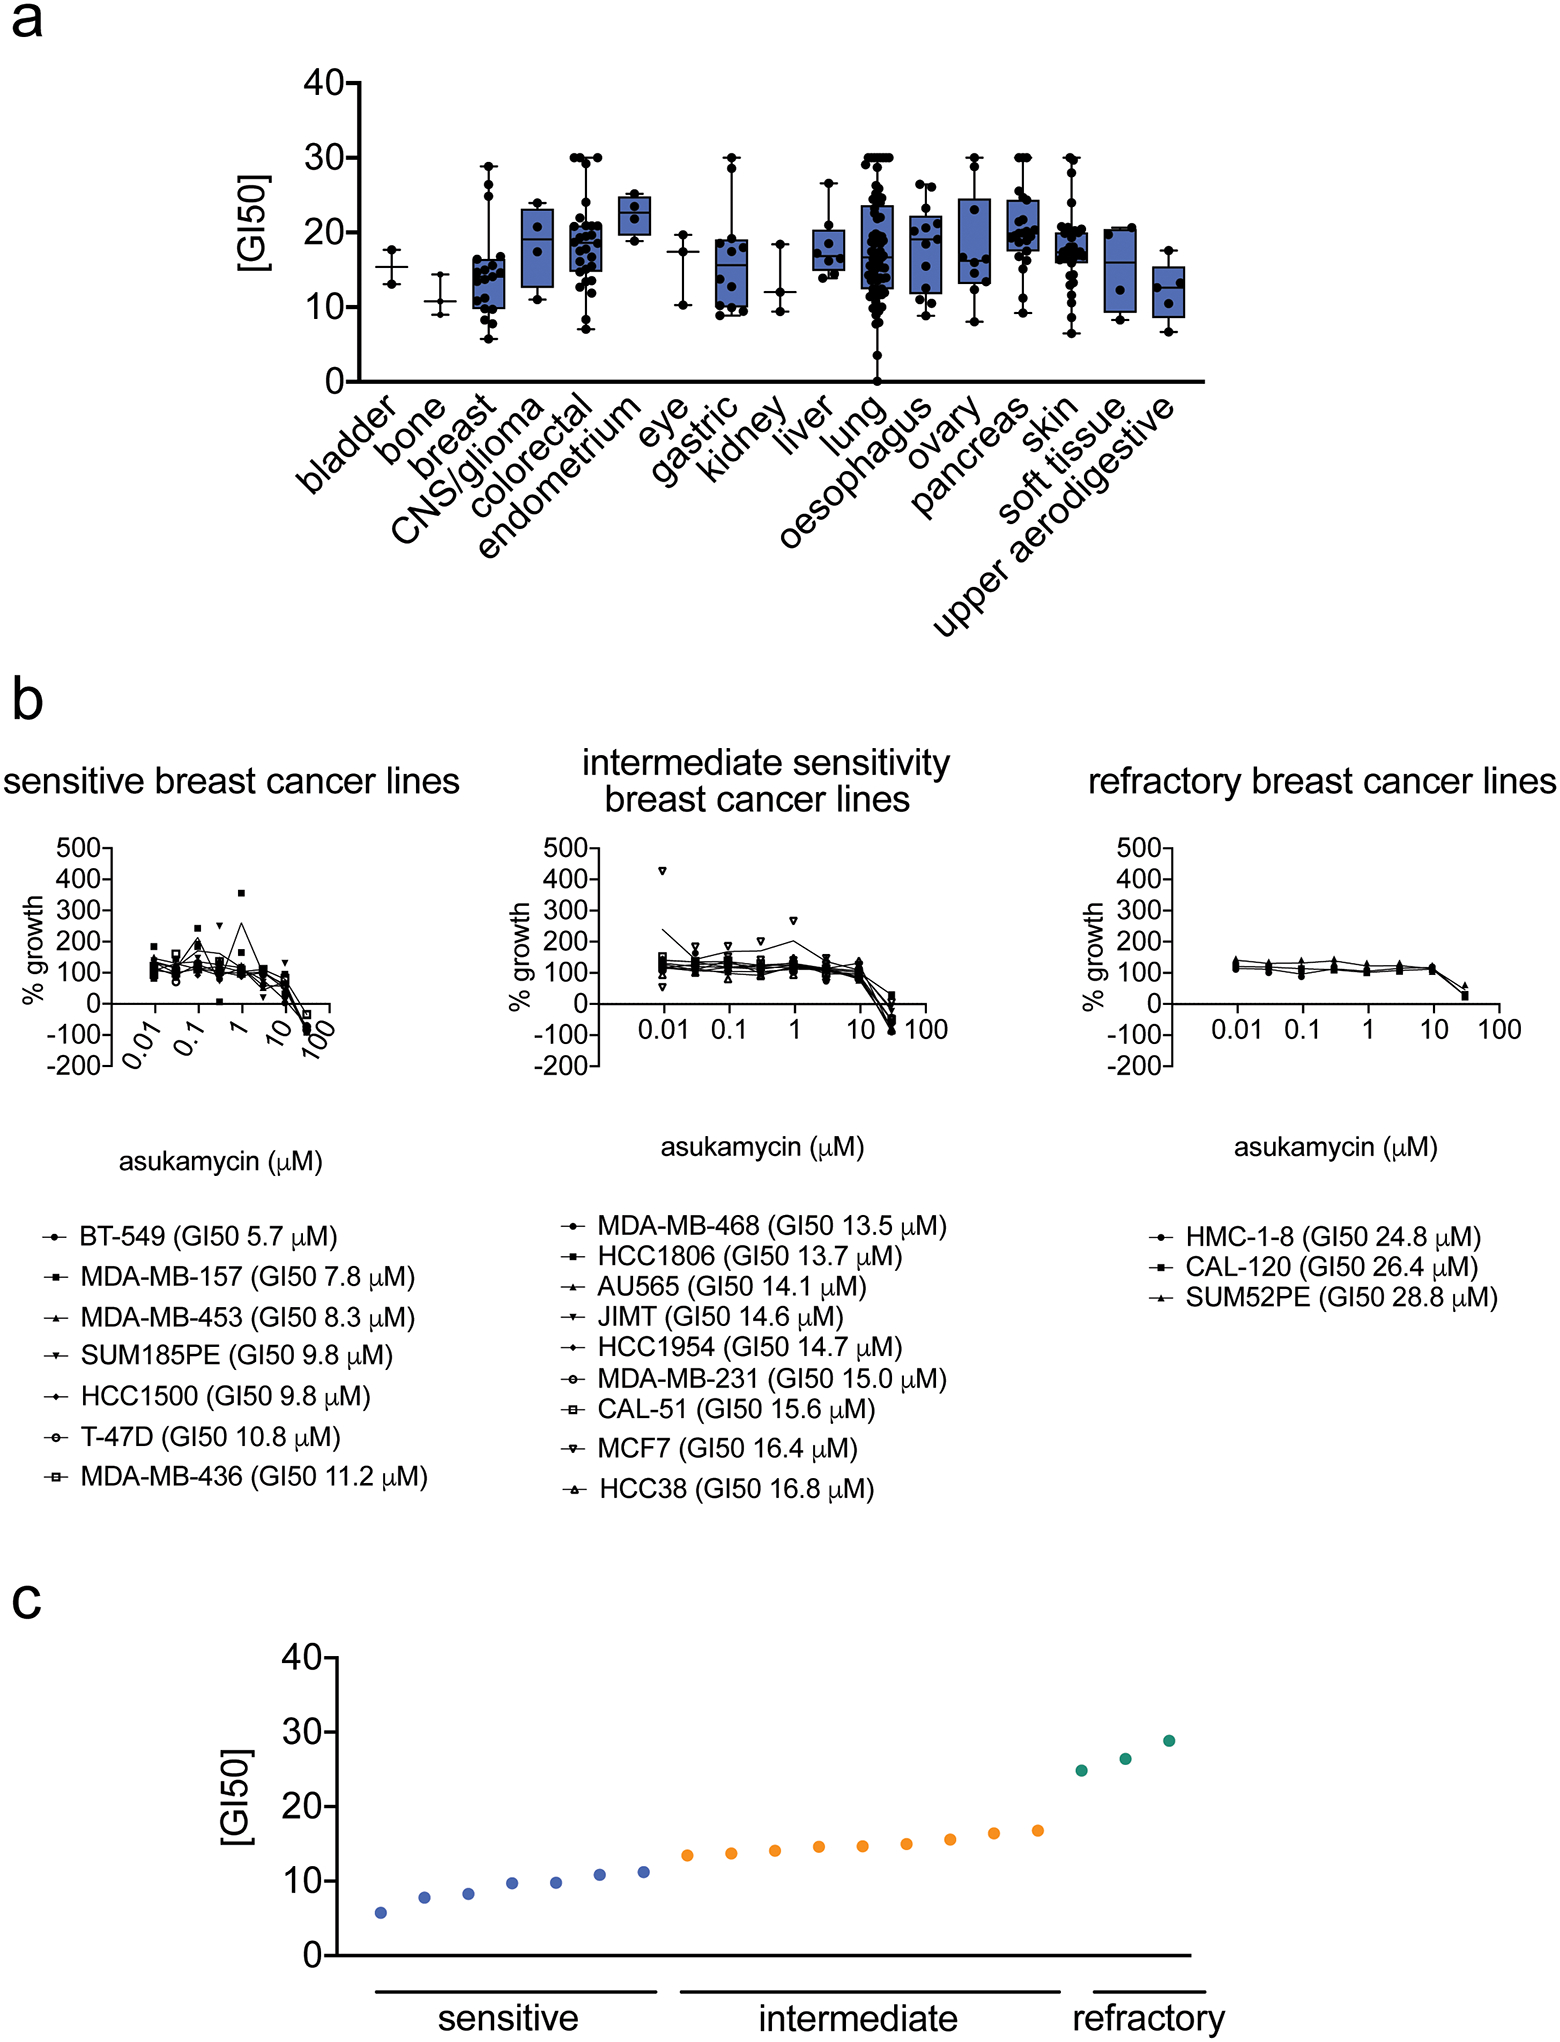
Extended Data Fig. 1. Testing asukamycin growth inhibitory effects across 250 cancer cell lines.

(a) GI50 values for asukamycin across 250 cancer cell lines by cancer tissue origin. The individual cell line data can be found in Source Data Tables for Extended Data Figure 1. The box plot shows median, standard deviation, and minimum and maximum ranges. For bladder cancer, there were 2 cell lines; for bone cancer, 3 cell lines; breast cancer, 19 cell lines; CNS/glioma cancers, 4 cell lines; colorectal cancer, 28 cell lines; endometrial cancer, 4 cell lines; eye cancers, 3 cell lines; gastric cancers, 12 cell lines; kidney cancer, 3 cell lines; liver cancer, 8 cell lines; liver cancer, 8 cell lines; lung cancer, 73 cell lines; esophageal cancer, 13 cell lines, ovarian cancer, 10 cell lines; pancreatic cancer, 23 cell lines; skin cancer, 35 cell lines; soft tissue cancers, 4 cell lines; upper aeodigestive cancers, 5 cell lines. (b, c) Dose-response curves for % growth of 19 breast cancer cell lines tested (b) and GI50 values (c) for asukamycin treatment, separated by relative sensitivity to asukamycin. Data from (a-c) were calculated in each cell line from n=2 biologically independent samples/group.
