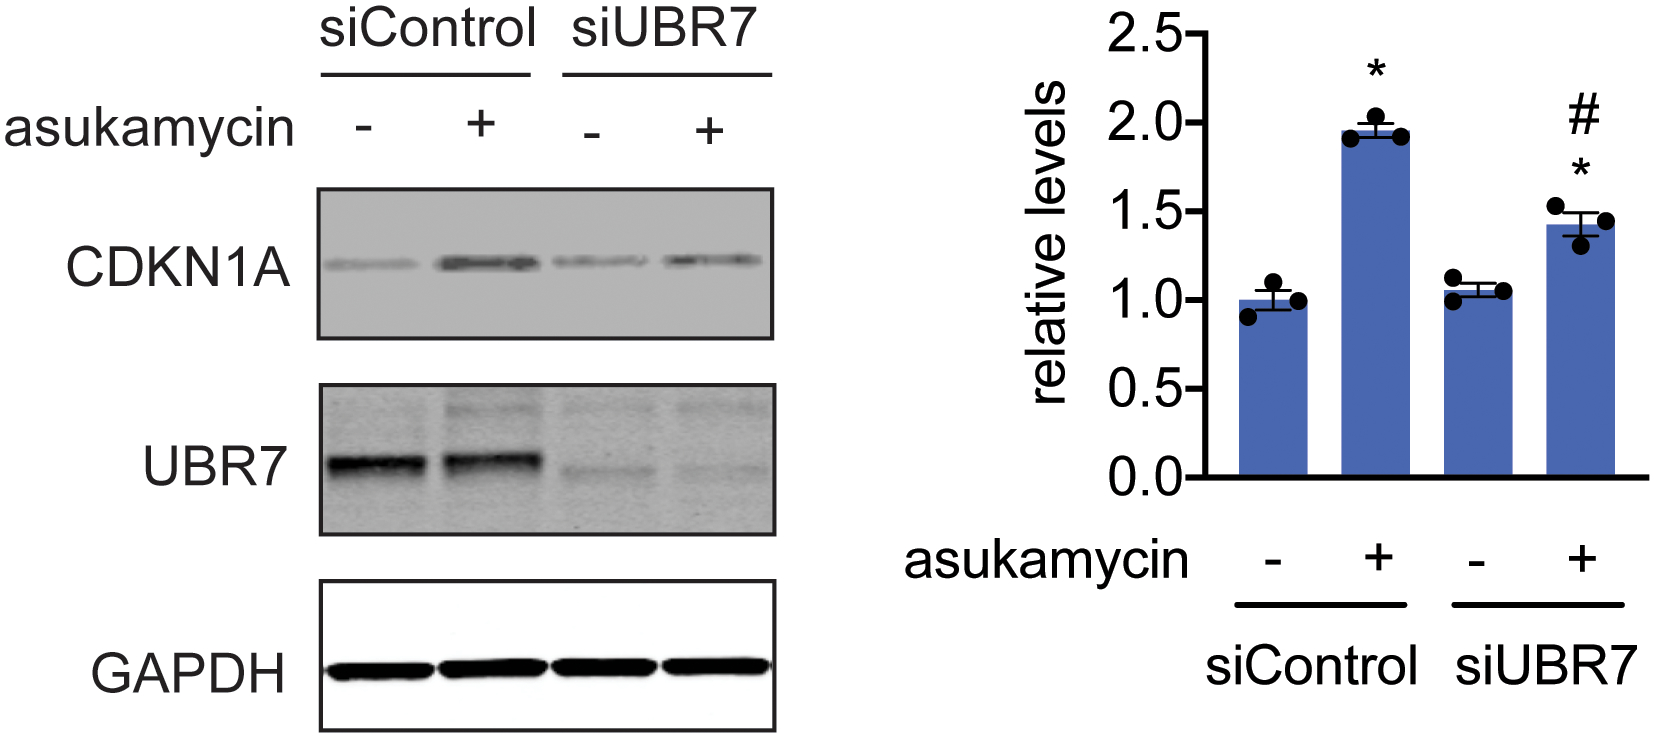
Extended Data Fig. 10. CDKN1A level changes with asukamycin treatment.

Tumor suppressor CDKN1A (p21), UBR7, and loading control GAPDH levels in 231MFP siControl and siUBR7 cells treated with DMSO vehicle or asukamycin (50 μM, 12 h), assessed by Western blotting, and quantified by densitometry and normalized to GAPDH levels. Gel on the left is representative of n=3 biologically independent samples/group. Bar graph on the right shows individual replicate values and average ± sem from n=3 biologically independent samples/group. Statistical significance is calculated with two-tailed unpaired Student’s t-tests and are shown as *p<0.05 compared to shControl vehicle-treated groups and #p<0.05 compared to shControl asukamycin-treated groups. Uncropped blots can be found in Source Data for Extended Figure 10. Source data for plots can be found in Source Data Tables for Extended Figure 10.
