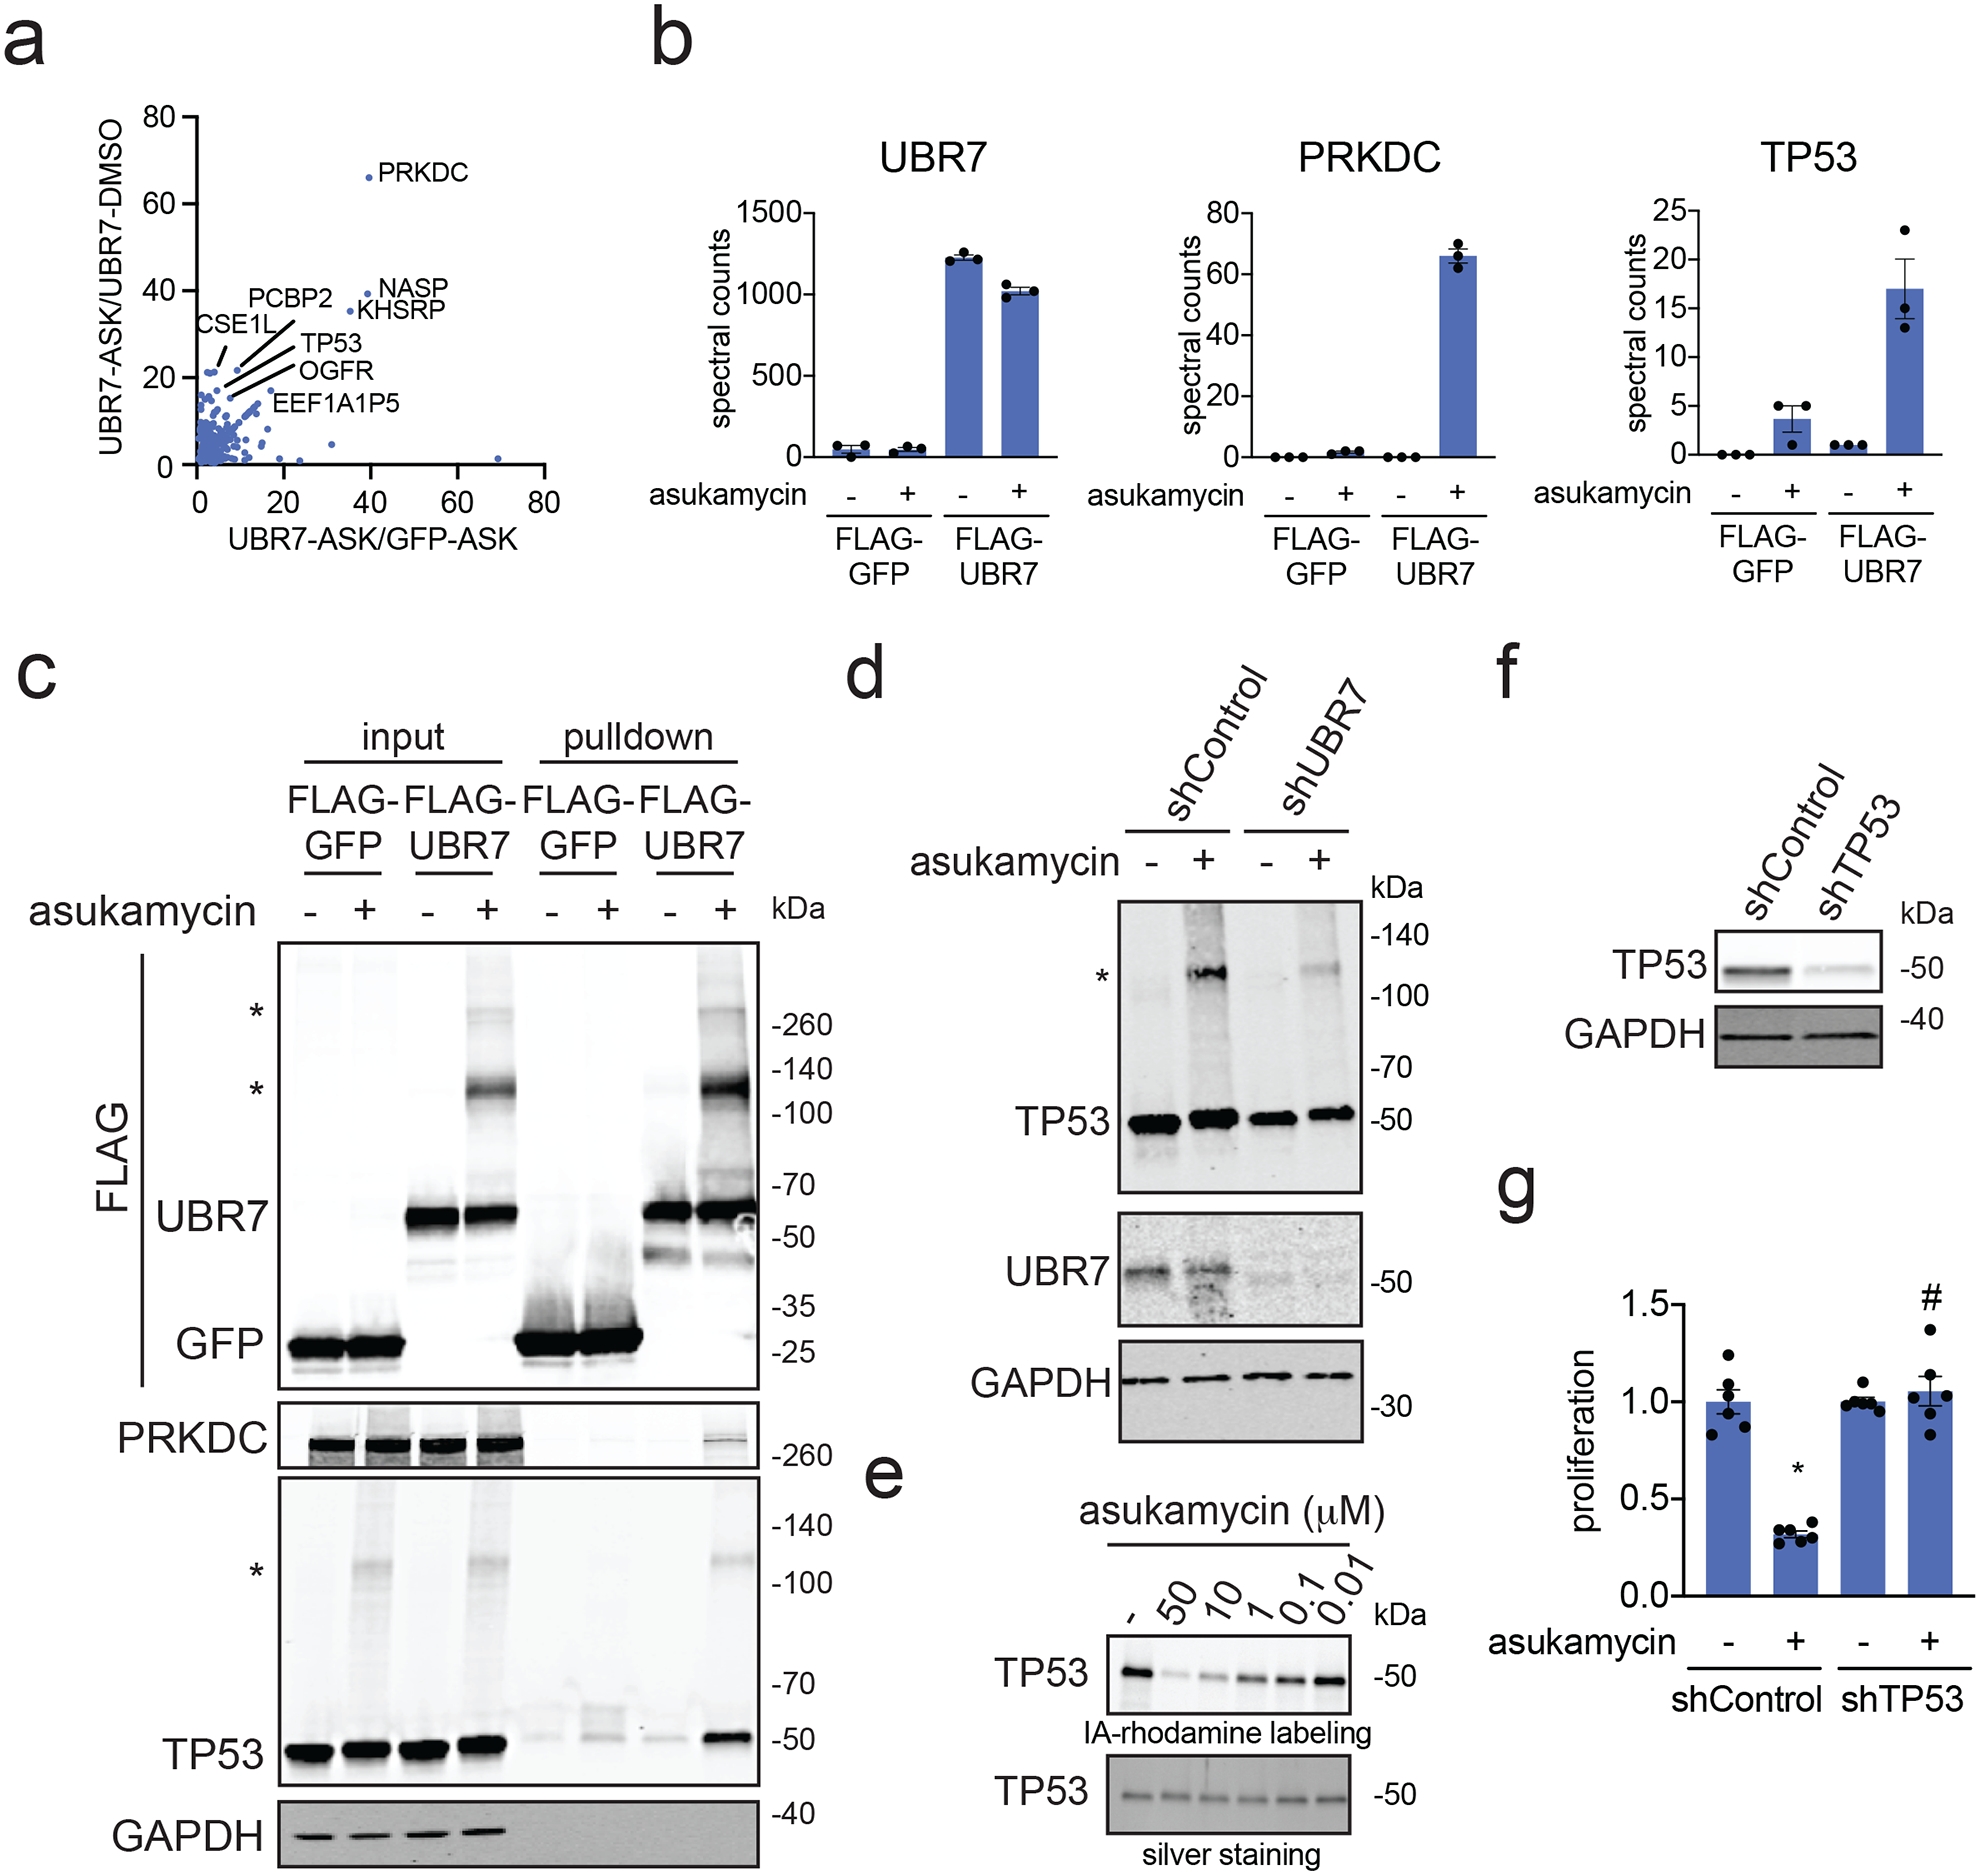
Figure 3. Mapping molecular glue interactions of asukamycin and UBR7.

(a) Proteomics analysis of molecular glue interactions of UBR7-asukamycin. 231MFP cells stably expressing FLAG-GFP or FLAG-UBR7 were treated with DMSO or asukamycin (50 μM) for 3 h. FLAG-GFP and FLAG-UBR7 interacting proteins were subsequently enriched and then subjected to proteomic analysis. Raw and analyzed proteomic analysis is shown in Source Data Tables for Figure 3 and is quantified by spectral counting. For those proteins that showed no peptides in a particular sample group, we set those proteins to 1 to enable relative fold-change quantification to generate this figure to visually show those proteins that showed high enrichment in asukamycin (ASK)-treated FLAG-UBR7 groups compared to asukamycin-treated FLAG-GFP groups on the x-axis and ASK-treated FLAG-UBR7 groups compared to DMSO-treated FLAG-UBR7 groups. Proteins highlighted showed >15-fold enrichment comparing UBR-ASK to UBR7-DMSO groups and >4-fold enrichment comparing UBR7-ASK to GFP-ASK groups. (b) Shown are spectral counts for representative proteins in the experiment described in (a). (c) Protein levels of FLAG-tagged proteins, PRKDC, TP53, and loading control GAPDH from a repeat of the experiment described in (a) by Western blotting showing specific interactions of PRKDC and TP53 with FLAG-UBR7 only when cells are treated with asukamycin. Higher molecular weight species of FLAG-UBR7 and TP53 are noted with (*). (d) anti-TP53, anti-UBR7, and loading control anti-GAPDH Western blots in shControl or shUBR7 231MFP cells treated with vehicle DMSO or asukamycin (50 μM) for 3 h. Higher molecular species of TP53 is noted with (*). Quantification for this gel is provided in Supplementary Figure 5a. (e) Gel-based ABPP analysis of asukamycin against pure human TP53 protein. TP53 protein was pre-incubated with DMSO vehicle or asukamycin for 30 min prior to IA-rhodamine labeling of TP53 for 1 h at room temperature. Protein was resolved by SDS/PAGE and visualized by in-gel fluorescence and protein loading was assessed by silver staining. (f) TP53 protein levels in 231MFP shControl and shTP53 cells. (g) Cell proliferation of 231MFP shControl and shTP53 cells treated with DMSO or asukamycin (10 μM) for 24 h. Data shown in (b and g) are shown as individual replicate values and average ± sem and are n=3 for (b) and n=6 for (g) biologically independent samples/group. Gels shown in (c, d, e, and f) are representative blots from n=3 biologically independent samples/group. Statistical significance was calculated with two-tailed unpaired Student’s t-tests and are shown as *p<0.05 compared to vehicle-treated controls within each group, #p<0.05 compared to asukamycin-treated shControl group in (g). Source data for cropped blots can be found in Source Data for Figure 3. Source data for bar graphs can be found in Source Data Tables for Figure 3.
