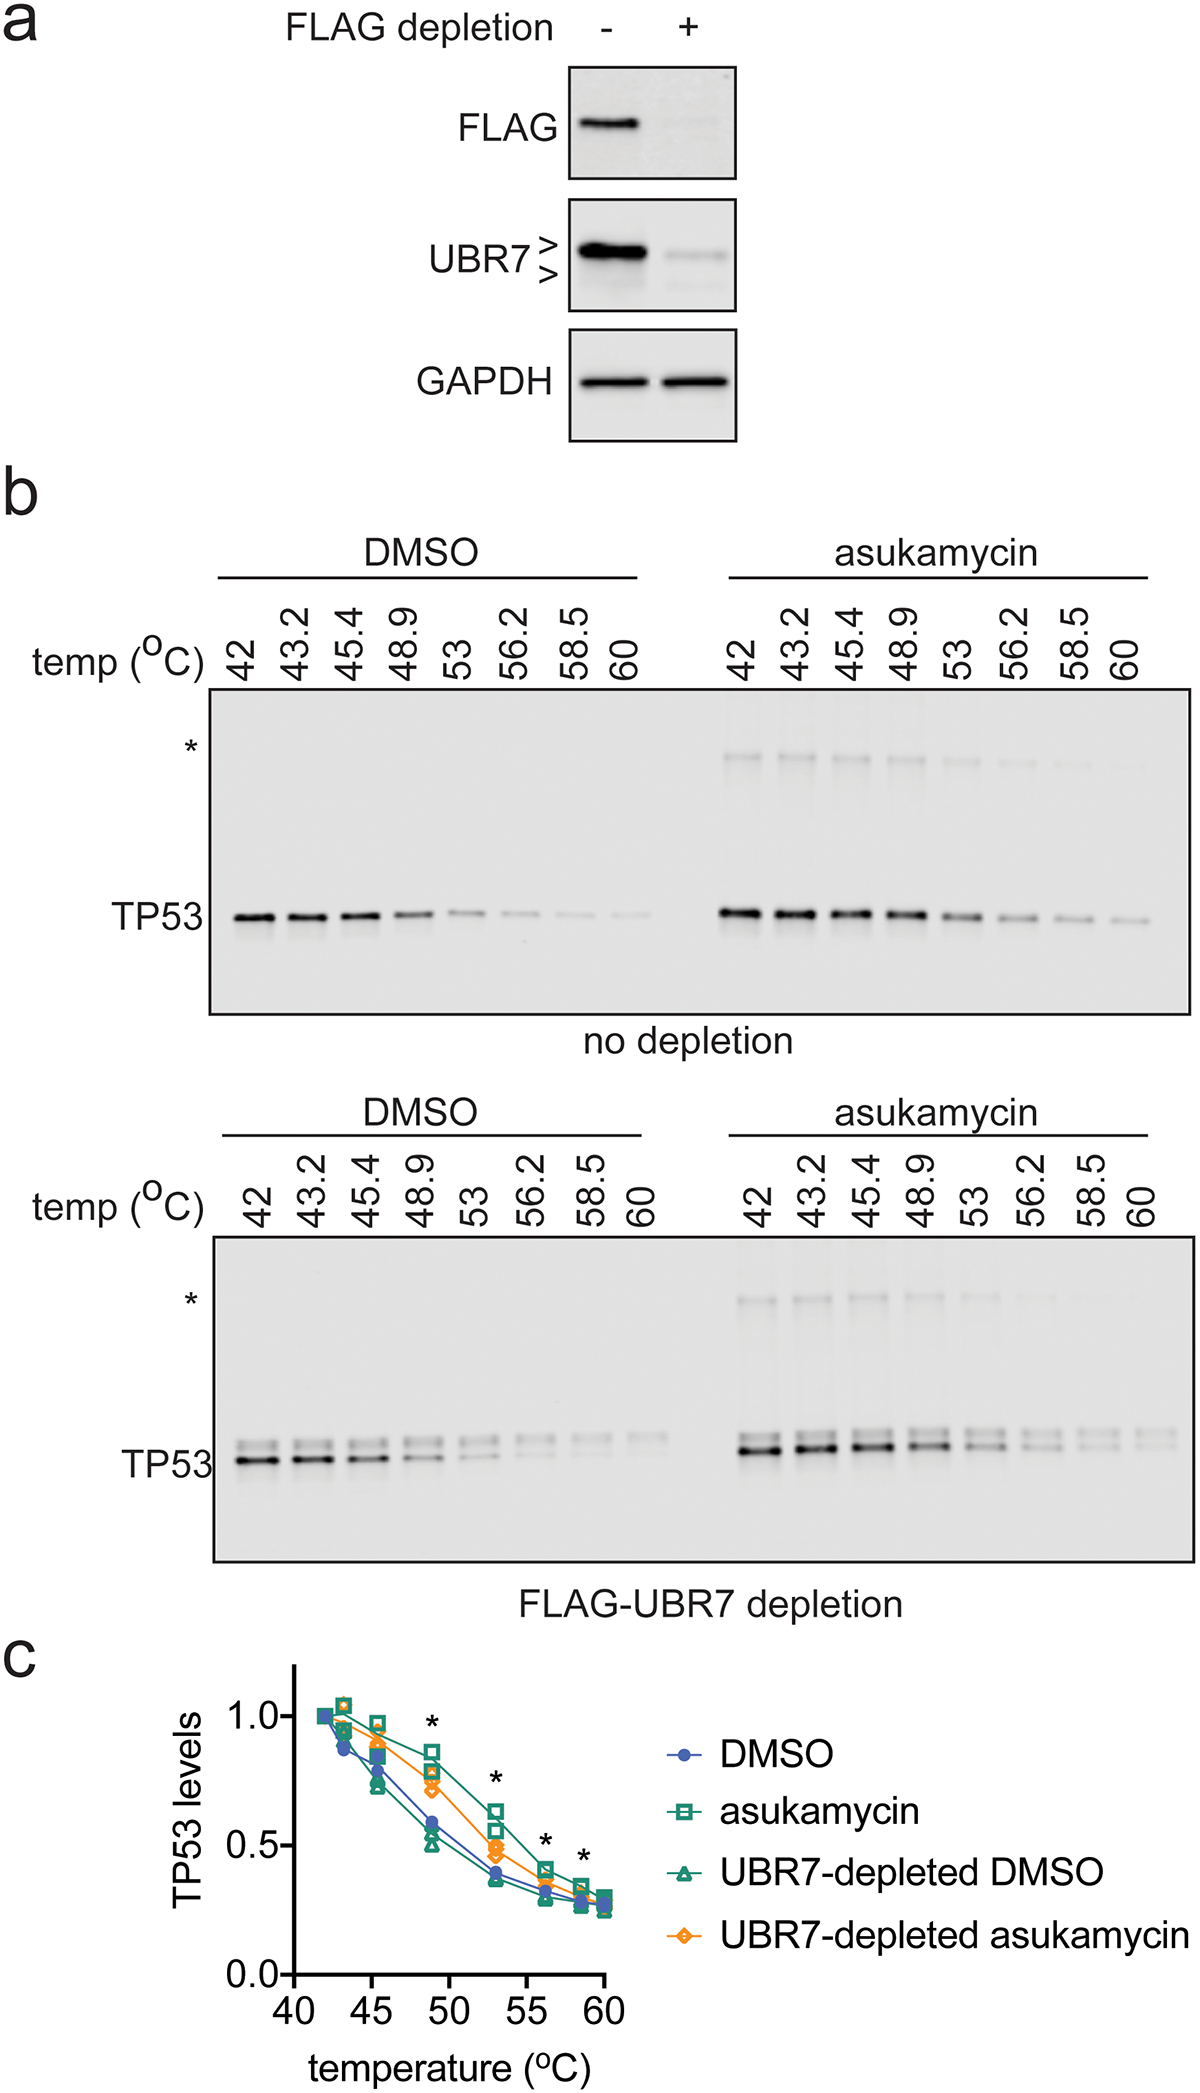
Extended Data Fig. 6. TP53 thermal stability.

(a) FLAG-UBR7, UBR7, and loading control GAPDH levels from 231MFP cells expressing FLAG-UBR7 after mock depletion or FLAG-UBR7 depletion as assessed by Western blotting. (b) TP53 thermal stability in cell lysate from 231MFP FLAG-UBR7-expressing cells treated with DMSO vehicle or asukamycin (50 μM, 1 h) after mock depletion or FLAG-UBR7 depletion. (c) Quantification of experiments described in (b). Gels in (a) are representative of n=3 biologically independent samples/group. Gels in (b) are representative of n=3 biologically independent samples/group which are quantified and shown as individual replicate values in (c). Statistical significance in (c) was calculated with two-tailed unpaired Student’s t-tests and are shown as *p<0.05 comparing UBR7-depleted asukamycin-treated groups to mock-depleted asukamycin-treated groups. Uncropped blots can be found in Source Data for Extended Figure 6. Source data for plots can be found in Source Data Tables for Extended Figure 6.
