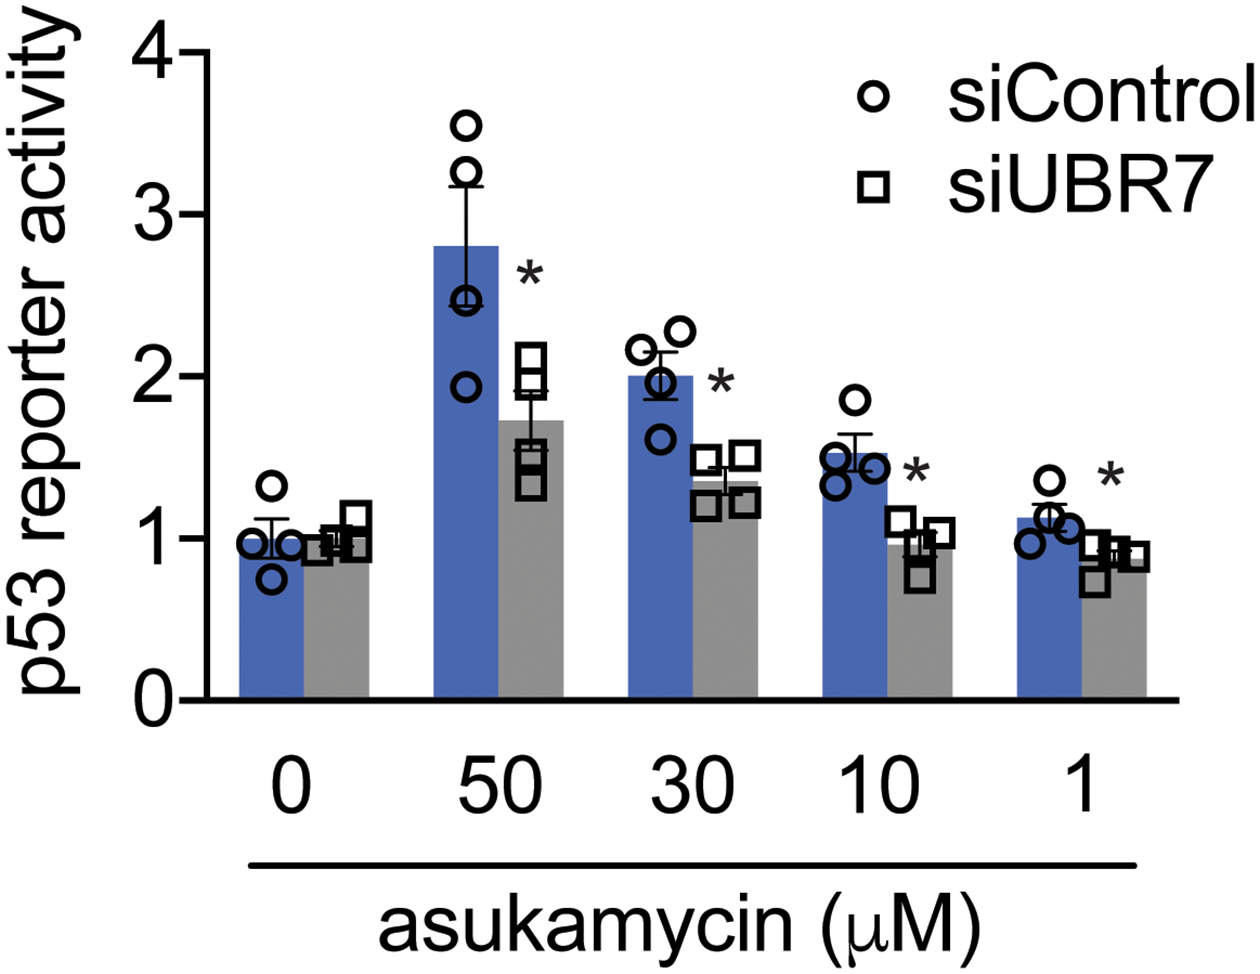
Extended Data Fig. 8. TP53 reporter activity.

TP53 reporter activity in HEK293T siControl and siUBR7 cells treated with DMSO vehicle or asukamcyin for 3 h. Data shown are individual replicate values and average ± sem from n=4 biologically independent samples/group. Statistical significance is calculated with two-tailed unpaired Student’s t-tests and are shown as *p<0.05 compared to corresponding siControl treatment groups. Source data for bar graph can be found in Source Data Tables for Extended Figure 8.
