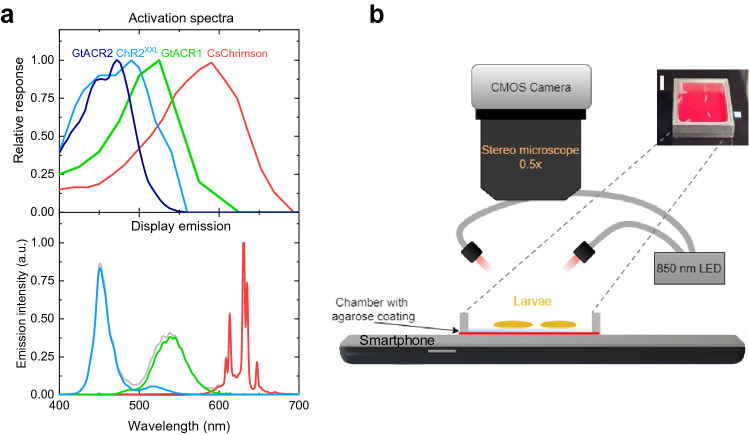
Figure 1.
Smartphone display for optogenetics. (a) Activation spectra of light-sensitive ion channels (top)11,33,34 and emission spectra of Honor 8 smartphone display used (bottom); lines in emission spectra correspond to display colour, given by RGB values: (0,0,255; blue), (0,255,0; green), (255,0,0; red), and (255,255,255; white). (b) Sketch of the experimental setup. Inset: photograph of the chamber containing several larvae, illuminated by red light from the smartphone. Scale bar: 5 mm.

