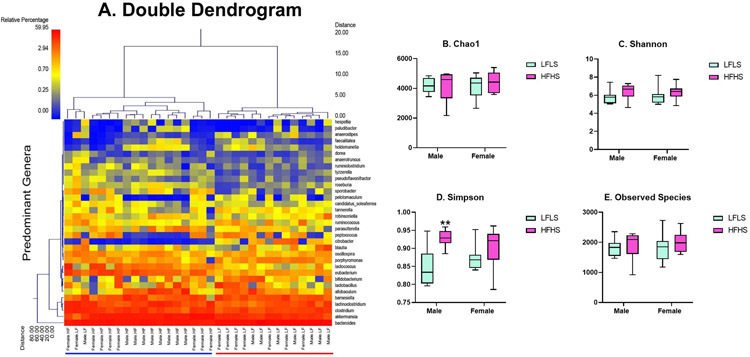
Figure 3:
Gut microbiome diversity (n = 8/group). To provide a visual overview combined with analysis, a dual hierarchal dendrogram is used to display the data for the predominant genera with clustering related to the different groups (A). Samples with more similar microbial populations are mathematically clustered closer together. The genera (consortium) are used for clustering. The samples with more similar consortium of genera cluster closer together with the length of connecting lines (top of heatmap) related to the similarity, shorter lines between two samples indicate closely-matched microbial consortium. The heatmap represents the relative percentages of each genus. The predominant genera are represented along the right Y-axis. The legend for the heatmap is provided in the upper left corner. Based on the clustering, there appears to be a significant difference between the mice exposed to a high fat diet and mice exposed to a low fat diet. Four α-diversity indices were evaluated. The Chao 1 diversity index (B), Shannon diversity index (C), and observed species (E) did not reveal significant differences in α diversity between the four groups. However, the Simpson index (D) revealed a significant difference.

