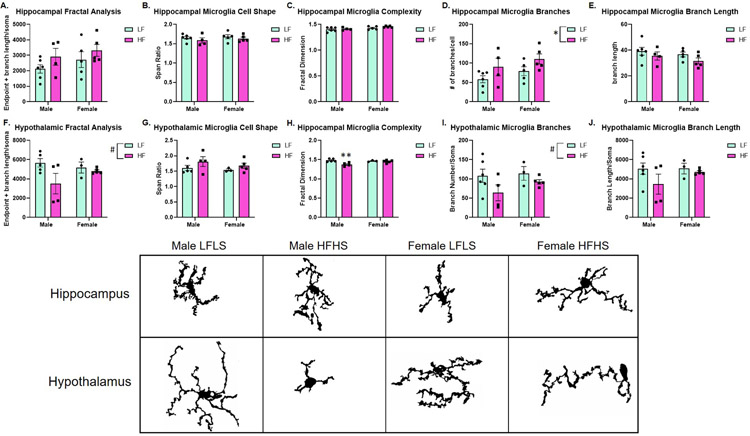
Figure 5:
Hippocampal and hypothalamic microglial analysis (n=4-6/group). (A-E) Microglial analysis in the hippocampus. A significant diet effect was determined for hippocampal branch number/soma (D). (F-J) Microglial analysis in the hypothalamus. A diet effect was approaching significance for fractal analysis (F) and branch number/soma (I). Male HFHS reveal decreased microglial complexity, as measured by fractal dimension, compared to Male LFLS (H). Microglia from each group and both brain regions are shown. Microglia were imaged at 100x then converted to binary images prior to skeleton and fractal analyses.

