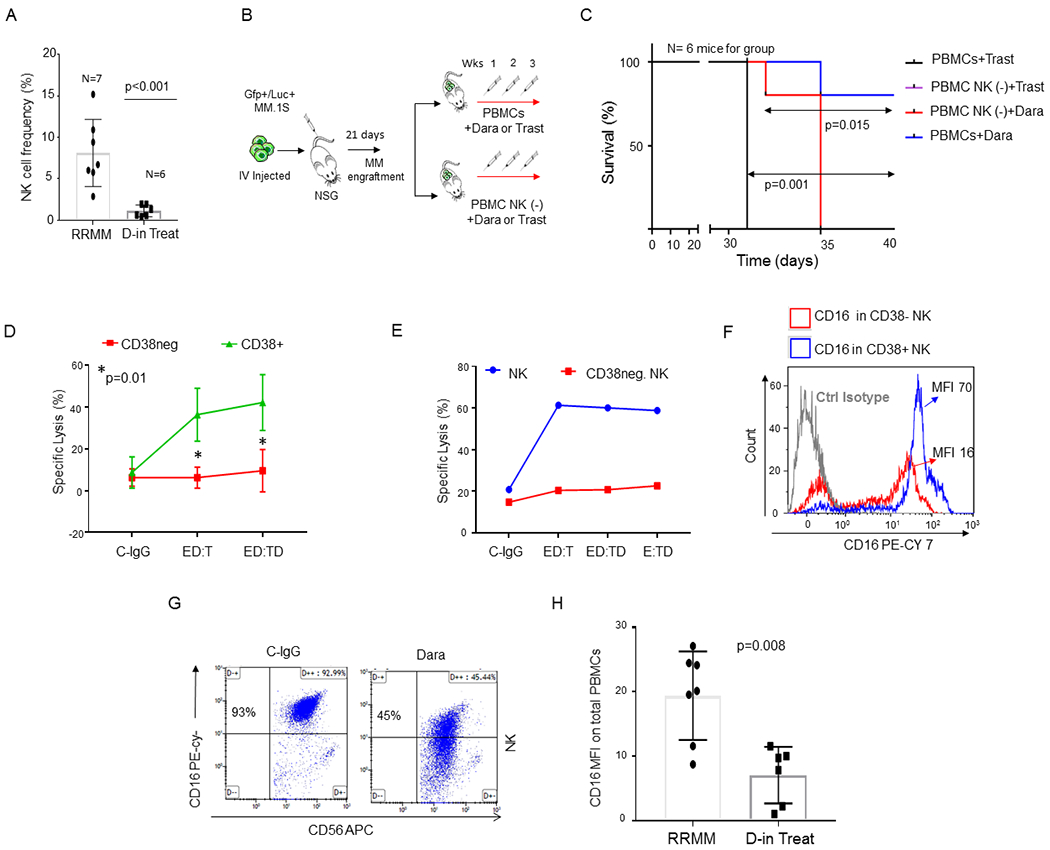
Fig. 1. CD38+ NK cells are essential for Dara-induced killing of MM cells.

A) Bar graphs showing NK cell reduction in the PBMCs isolated from refractory MM patients (RRMM) and refractory MM patients actively on Dara treatment (D-in Treat) (p<0.001). Mann-Whitney-Wilcoxon test was performed; B) Schematic illustration of the animal treatment schedule. 5x10⁶ MM.1S GFP+/Luc+ cells were injected intravenously (IV) into NSG mice. On day 13, after engraftment reached approximately ≥2x10⁶ photons/sec/cm2/sr, mice were randomly distributed into 4 experimental groups and injected three times once a week by intravenous injection with 1x10⁶ PBMCs or PBMCs depleted of total NK cells [PBMCs NK(−)] pretreated for 30 min with 125 μg Dara or trastuzumab (Trast), and co-injected; C) Survival curves of the 4 different mice groups described in B. Mice treated with PBMCs+Trast and treated with NK cell–depleted PBMCs [PBMC NK (−)+Trast] simultaneously reached IACUC guidelines for euthanasia and are reported with overlapping lines (black/purple); D) Line graph reporting the percentage of dead cells as 7-AAD-positive among target cells (MM.1S GFP+ cells) of at least n=3 HDs repeated in triplicate; E) Killing assay in terms of specific lysis (%) by total primary NK cells or CD38(−) NK cells (E) and incubated overnight with C-IgG and Dara, washed, and co-cultured with Gfp+ MM.1S cells (T) for 4hrs. The same HD donor was used for the comparison analysis; F) Overlay histogram showing that CD16 levels are almost 80% less on the surface of CD38(−) NK cells compared to that in the CD38+ NK cell population in the blood of the same HD. Two HDs were analyzed by flow analysis. CyTOF analysis was also performed in 1 independent HD and 1 MM patient (see Sup. Fig. 1D); G) Representative flow cytometry of CD16 surface expression of NK cells after an overnight treatment with control IgG (C-IgG) or Dara; H) Bar graph showing CD16 levels in non-refractory MM patients actively on Dara treatment (D-in Treat) compared to that in untreated RRMM patients (p=0.008).
