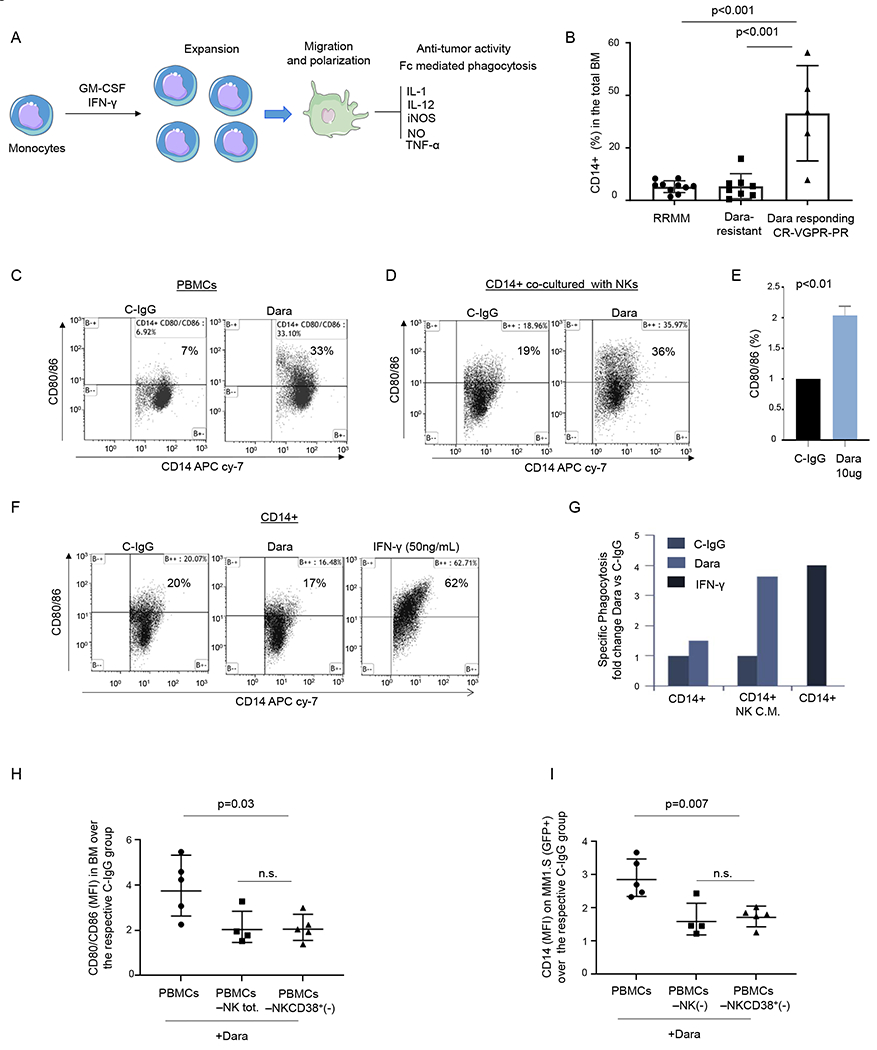
Fig. 4. NK cell activation by Dara is essential for monocyte activation and polarization.

A) Illustration showing monocyte activation and polarization to M1 monocytic-derived macrophages with anti-tumor activity; B) Percent of CD14+ cells in the total BM in RRMM, Dara-resistant, and patients actively responding to Dara (Dara responding); C) Representative flow cytometric analysis of CD80/86 in PBMCs (n=2 HD) and treated overnight with Dara (10 μg/ml), showing up-regulation of CD80/86 antigens in contrast to that from C-IgG; D) Representative flow cytometric analysis of CD80/86 in monocytes isolated from a healthy donor co-cultured with CD38+NK cells (isolated from the same healthy donor) treated overnight with C-IgG or Dara (10 μg/ml); The experiment was repeated in n=3 HDs. E) Bar graph showing CD80/86 upregulation in CD14+ cells co-cultured with Dara-treated NK cells versus C-IgG–treated cells. The experiment was repeated using 3 HDs and the average ±SD is reported; p values were calculated using t test, unpaired (tails = 2); F) Flow cytometry analysis of CD80/86 in CD14+ cells treated overnight with C-IgG, Dara or IFN-γ (50 ng/ml); The experiment was repeated in n=3 HDs. G) Phagocytosis assay was performed on the CD14+ population isolated from a healthy donor (n=1), treated for 72hrs with conditioned media (CM) collected from NK cells treated overnight with C-IgG (10 μg/ml) or Dara (10 μg/ml), and compared to the CD14+ isolated population treated for 72hrs with IFN-γ (50 ng/ml) at the same timepoint; H-I) Dot plot graphs showing the CD80/86+/CD14+ population MFI) and the GFP+/CD14+ population (MFI), as assessed by flow cytometry, isolated from the BM of mice injected with total human PBMCs, PBMC NK(−), and PBMC depleted of CD38+ NK cells[PBMC NKCD38+(−)]. Data reported in H) and I) represent the mean ± SD; p values were calculated using multi comparison one-way ANOVA.
