
Figure 1. Microglia depletion and re-population in the mouse brain.
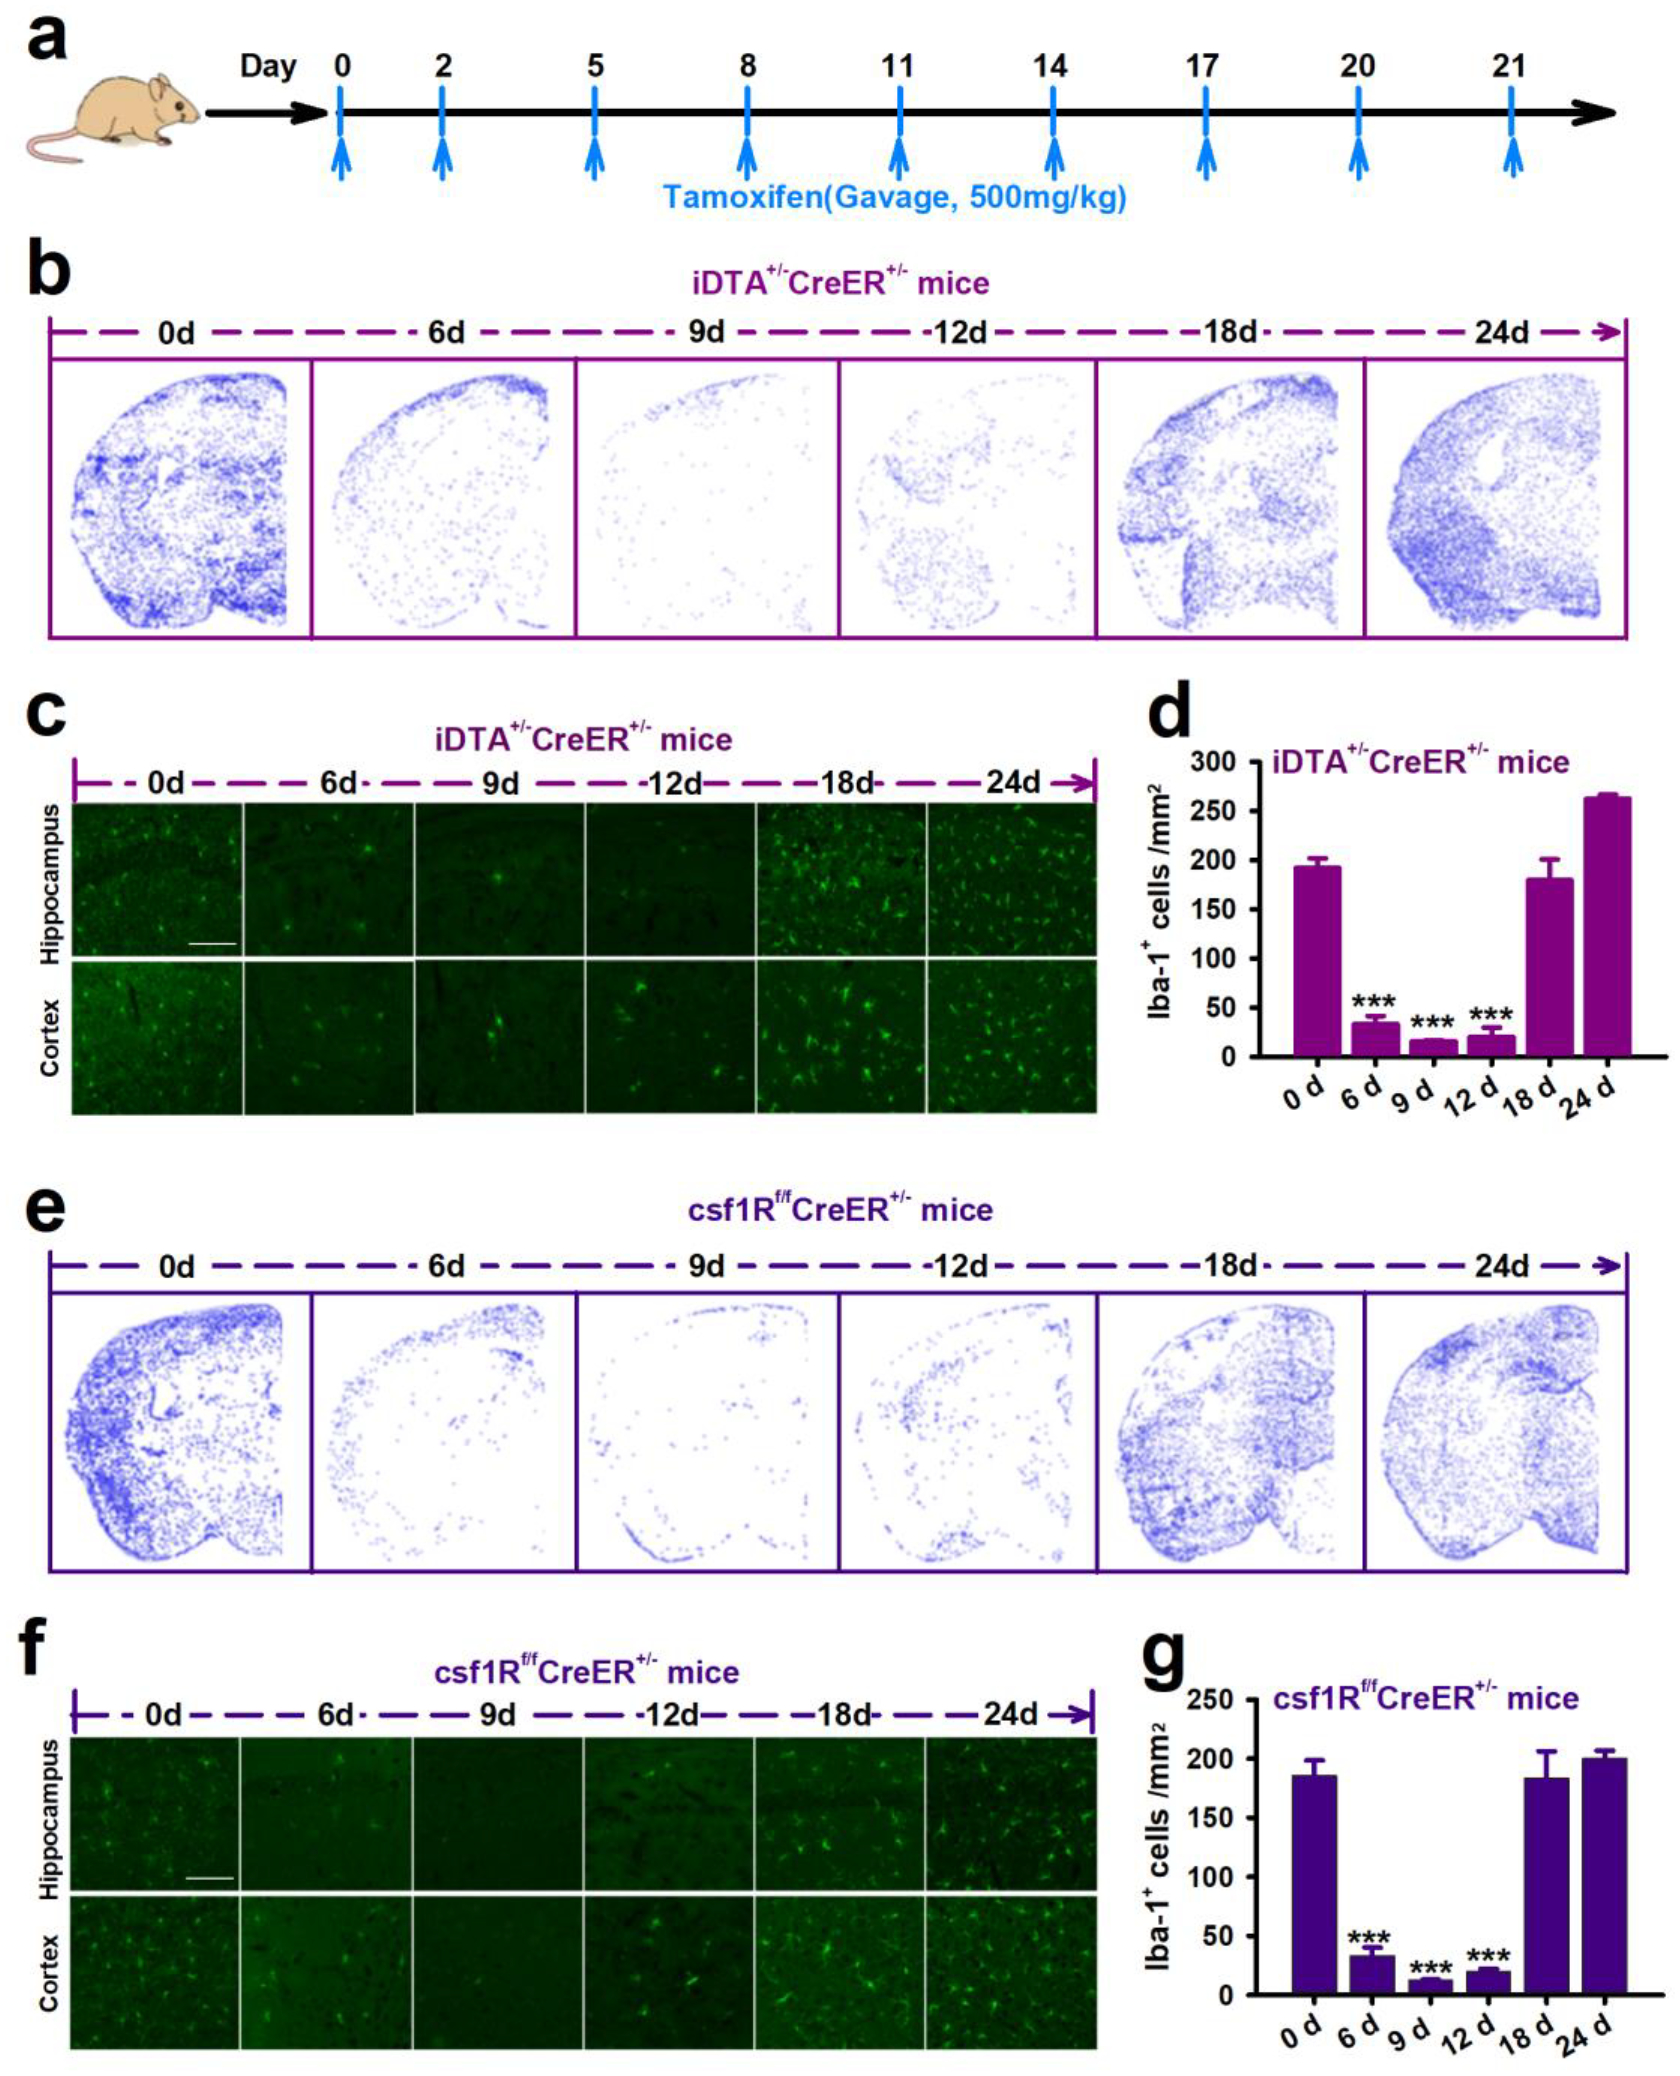
a, Tamoxifen treatment scheme. b,e, Representative images showing microglia depletion and re-population in the brain of iDTA mice (b) and Csf1r mice (e). Using Analyze Particles in ImageJ to perform automatic cell counting, each blue dot represents a microglial cell. c,f, Immunostaining images of Iba1+ microglial cells in the hippocampus and cortex of iDTA mice and Csf1r mice during the time course of depletion and re-population. Scale bar=50 μm. d,g, Quantification of Iba+ microglial cells in the brain of iDTA mice and Csf1r mice treated with tamoxifen. Data presented as means ± SEM, n=3–4, ***P<0.001 vs 0d.