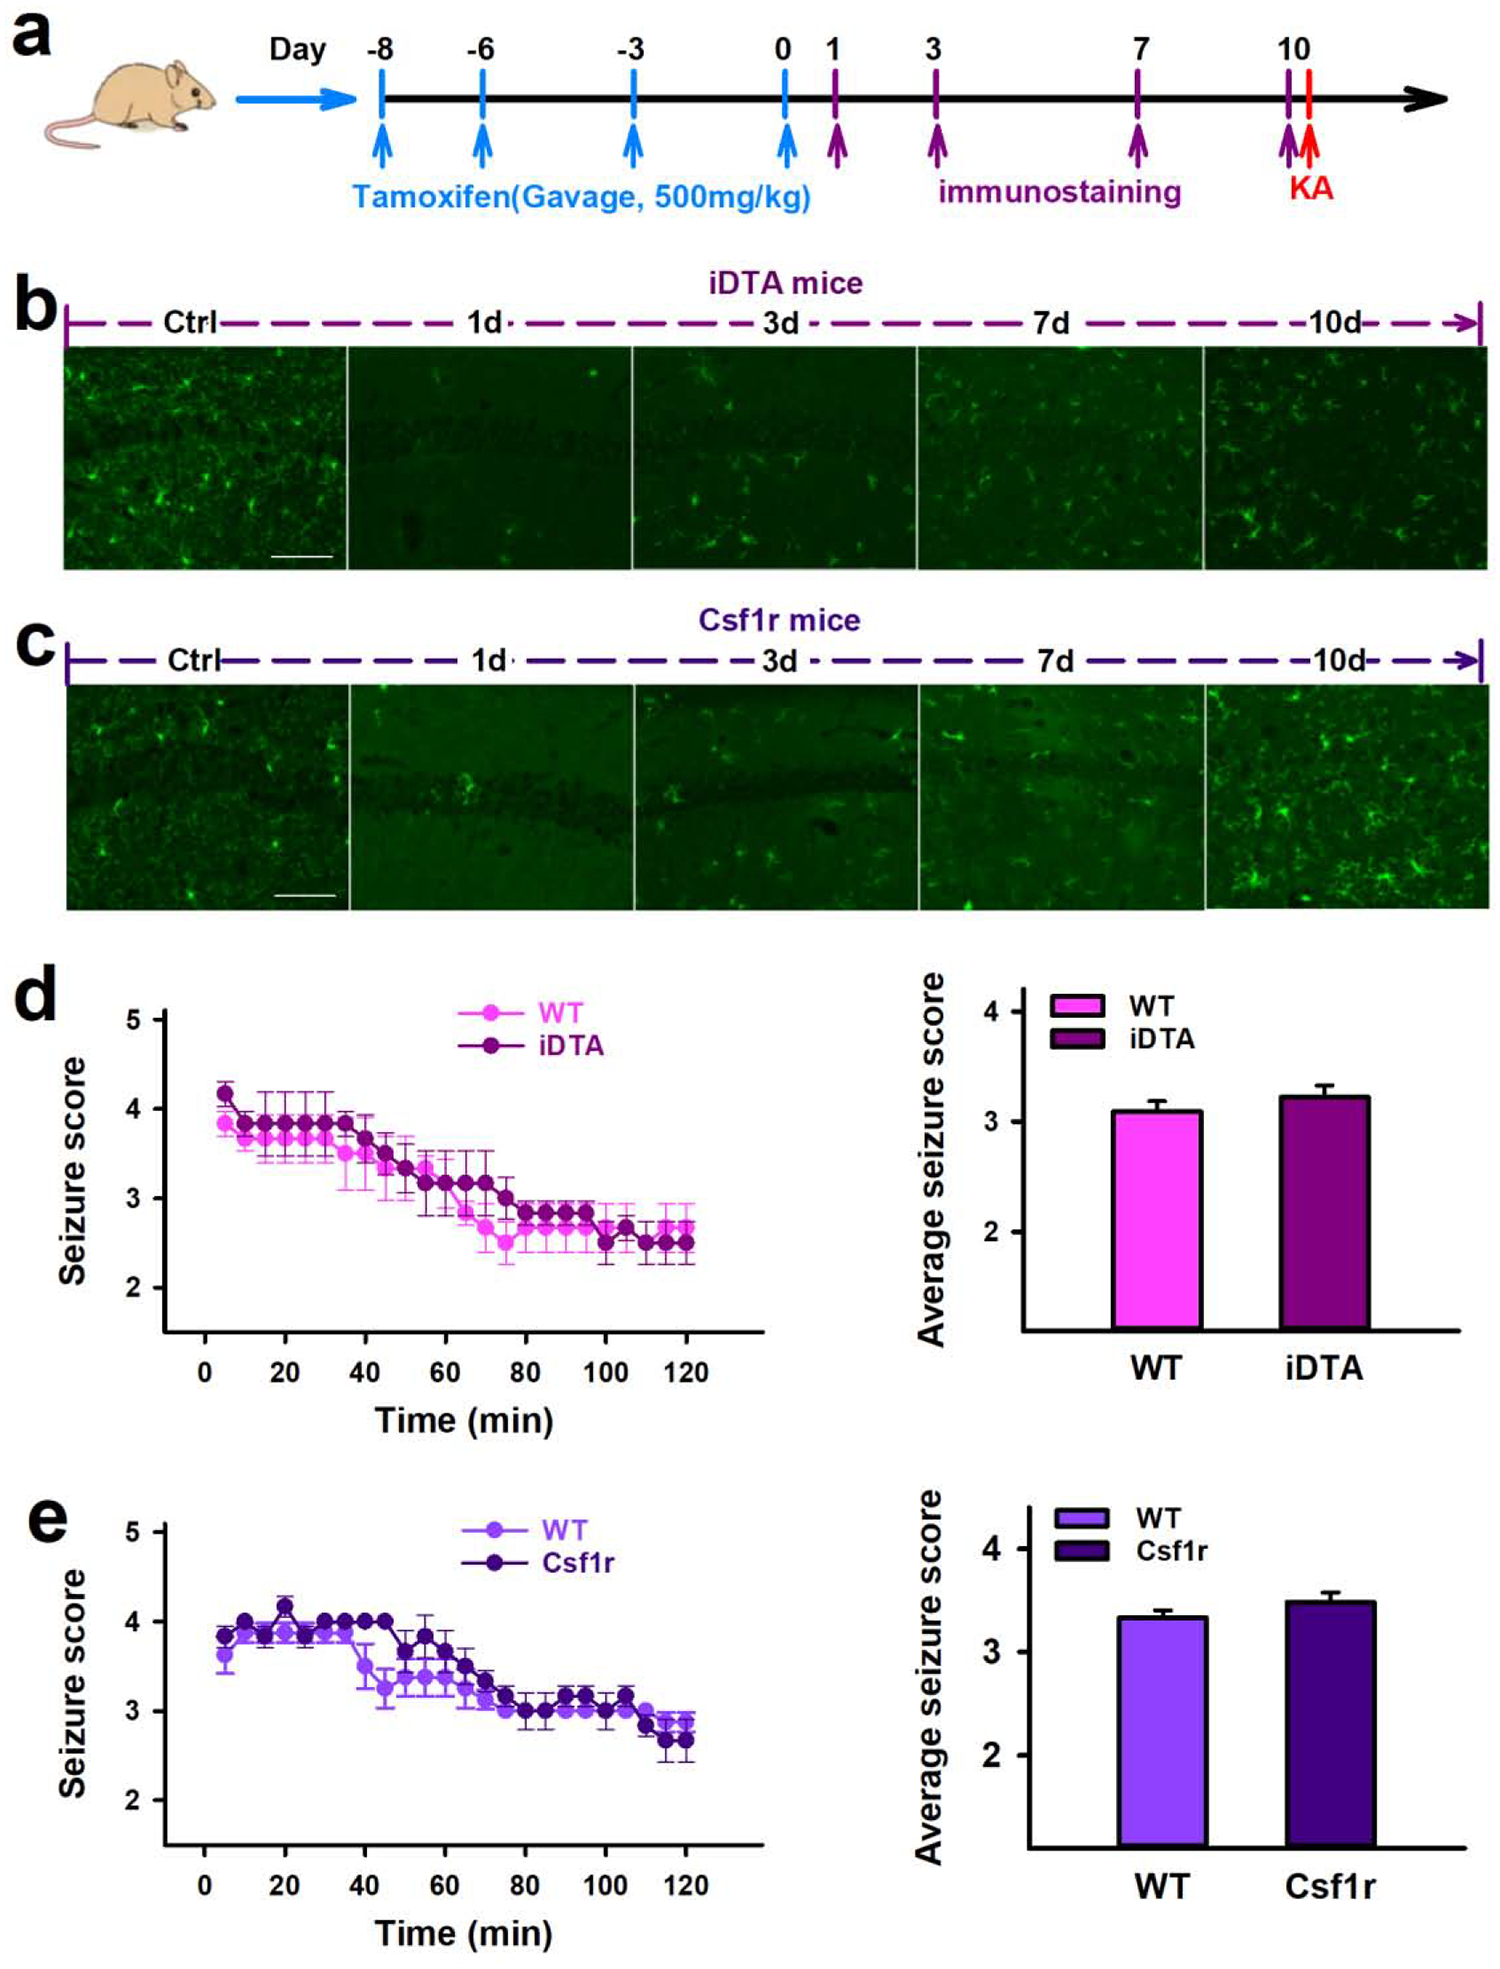
Figure 6. Re-populated microglia did not alter seizures induced by KA.

a, Drug treatment, immunostaining and behavior test scheme in iDTA and Csf1r mice. b–c, Representative images showing the time course of microglia repopulation in the hippocampus following rapid depletion in iDTA mice (b) and Csf1r mice (c). Scale bar =50 μm, n=3. d–e, Quantification of seizure scores show that iDTA mice and Csf1r mice with repopulated microglia have similar seizure scores compared with their respective controls. Data presented as means ± SEM, n=6–8.
