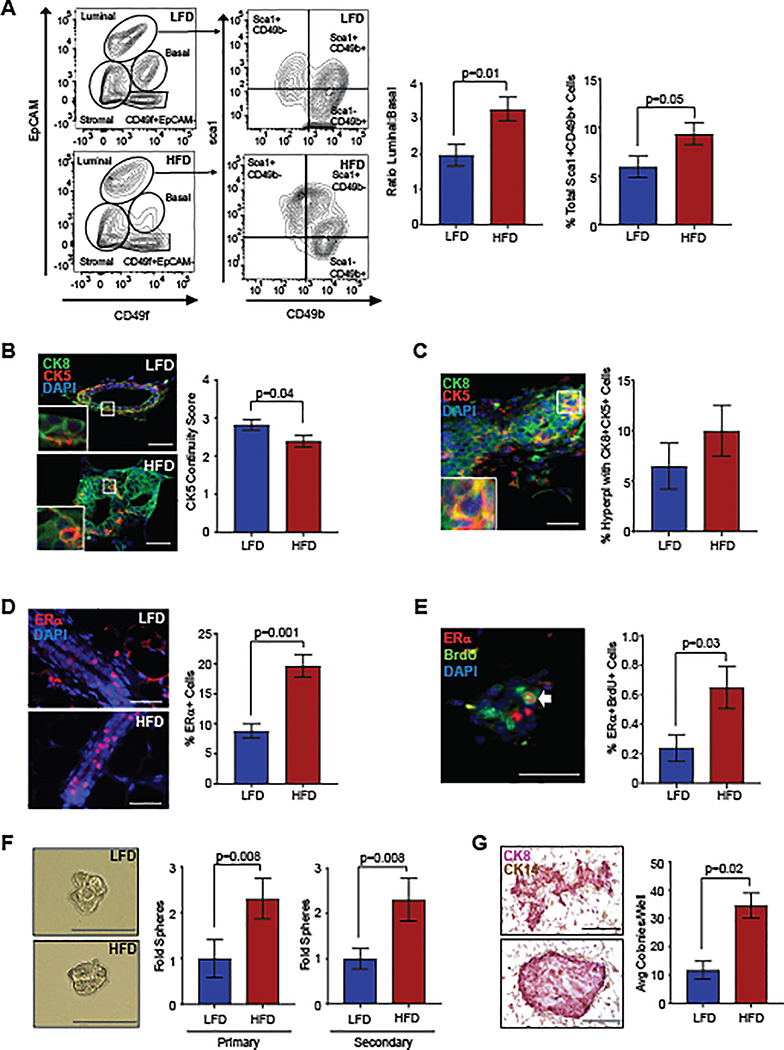
Figure 3.
Obesity increased p53−/− MEC stem/progenitor activity 8 weeks following transplant. A. Representative contour plots depict gates for luminal cells (EpCAMhiCD49flo) and basal cells (EpCAMloCD49fhi). Luminal cells were also gated by expression of Sca-1 and CD49b (n=9/group). B. Continuity of CK5+ basal cells surrounding CK8+ luminal cells (n=5/group). C. MECs expressing both CK8 and CK5 (yellow). D. Percent ERα+ MECs in mammary ducts (n=5/group). E. Percent of MECs co-labeled for ERα and BrdU (n=5/group). F. Isolated MECs were plated to form primary and secondary mammospheres (n=5–6/group). G. MEC colonies expressed CK8 and CK14 (n=5–6/group). Magnification bar=50 μm.

