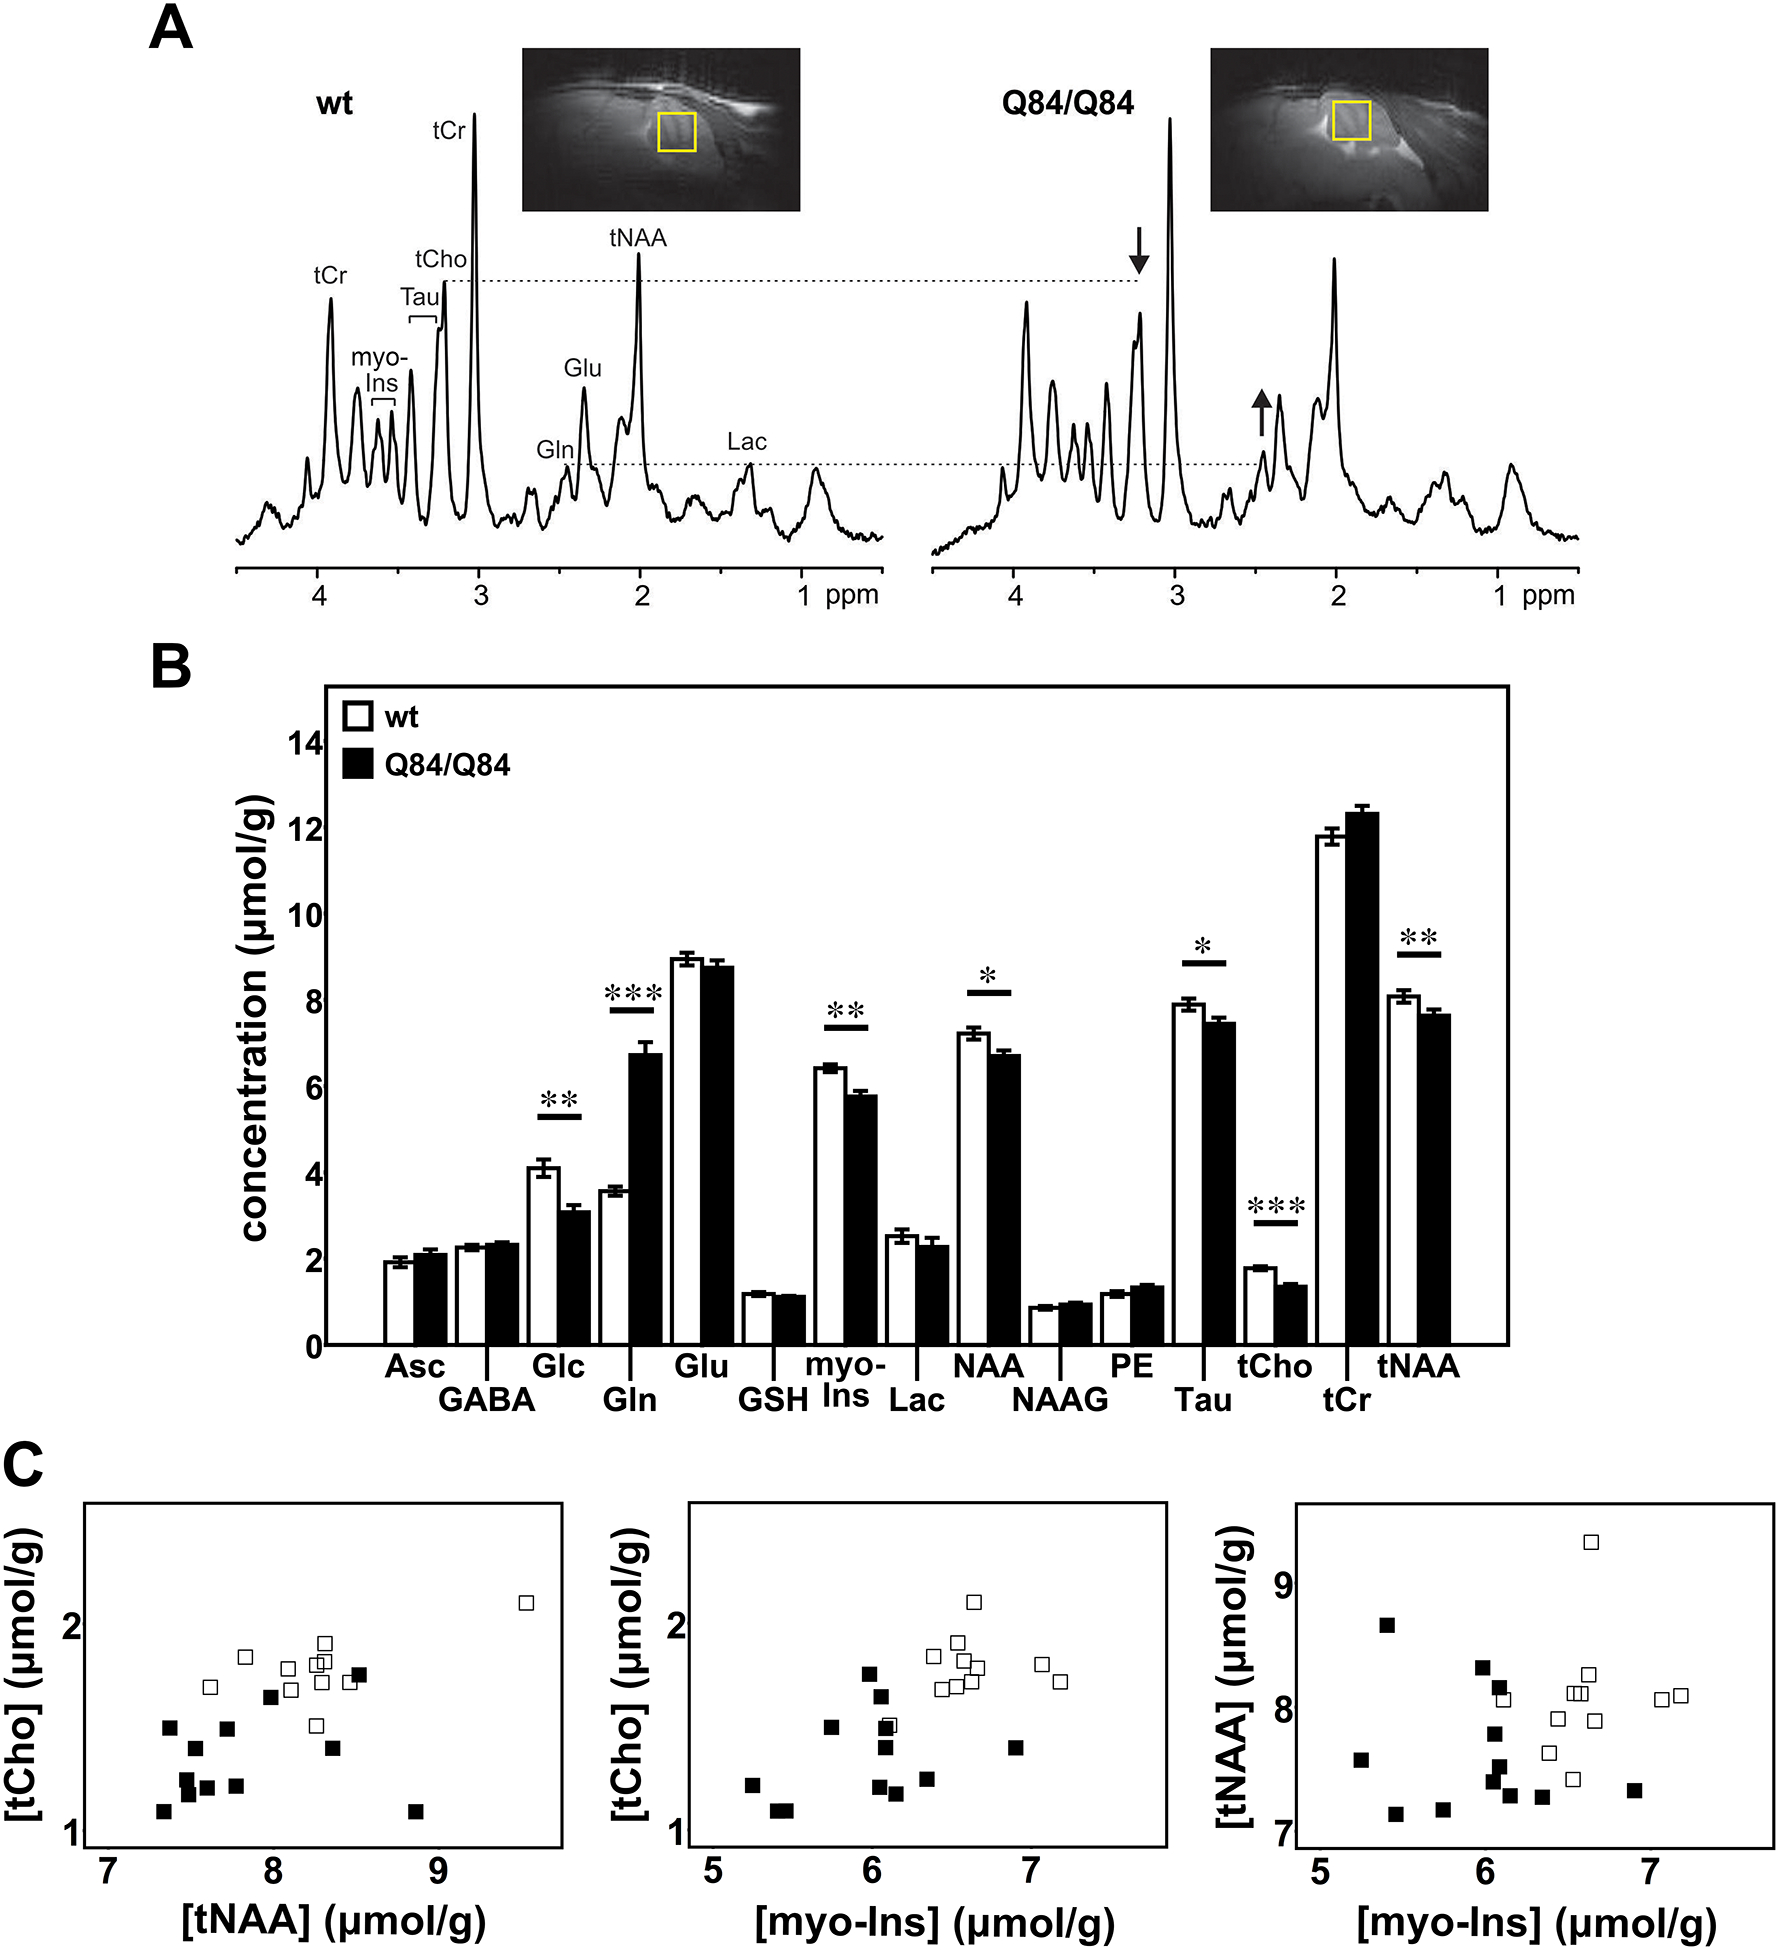
Figure 1: Cerebellar neurochemical levels are altered in homozygous Q84/Q84 mice.

A) Representative localized proton MR spectra and midsagittal T2-weighted images of a Q84/Q84 and a wt littermate mouse. The most prominent neurochemical abnormalities, namely lower tCho and higher Gln in Q84/Q84 compared to wt mice, are denoted in the spectra by arrows. B) Cerebellar neurochemical profiles of Q84/Q84 mice (N=12, black bars) and wt littermates (N=11, white bars). Bars represent average neurochemical concentration ± SEM. Comparison between mouse genotypes was performed using Student’s t-test and statistical significance is indicated as: *P<0.05, **P<0.01, and ***P<0.001. C) Separation of Q84/Q84 mice (black squares) from controls (white squares) by plotting two altered metabolites against each other.
