
Figure 5: Cerebella from miRATXN3-treated Q84/Q84 show higher levels of MBP and NFL medium compared to vehicle-treated Q84 animals.
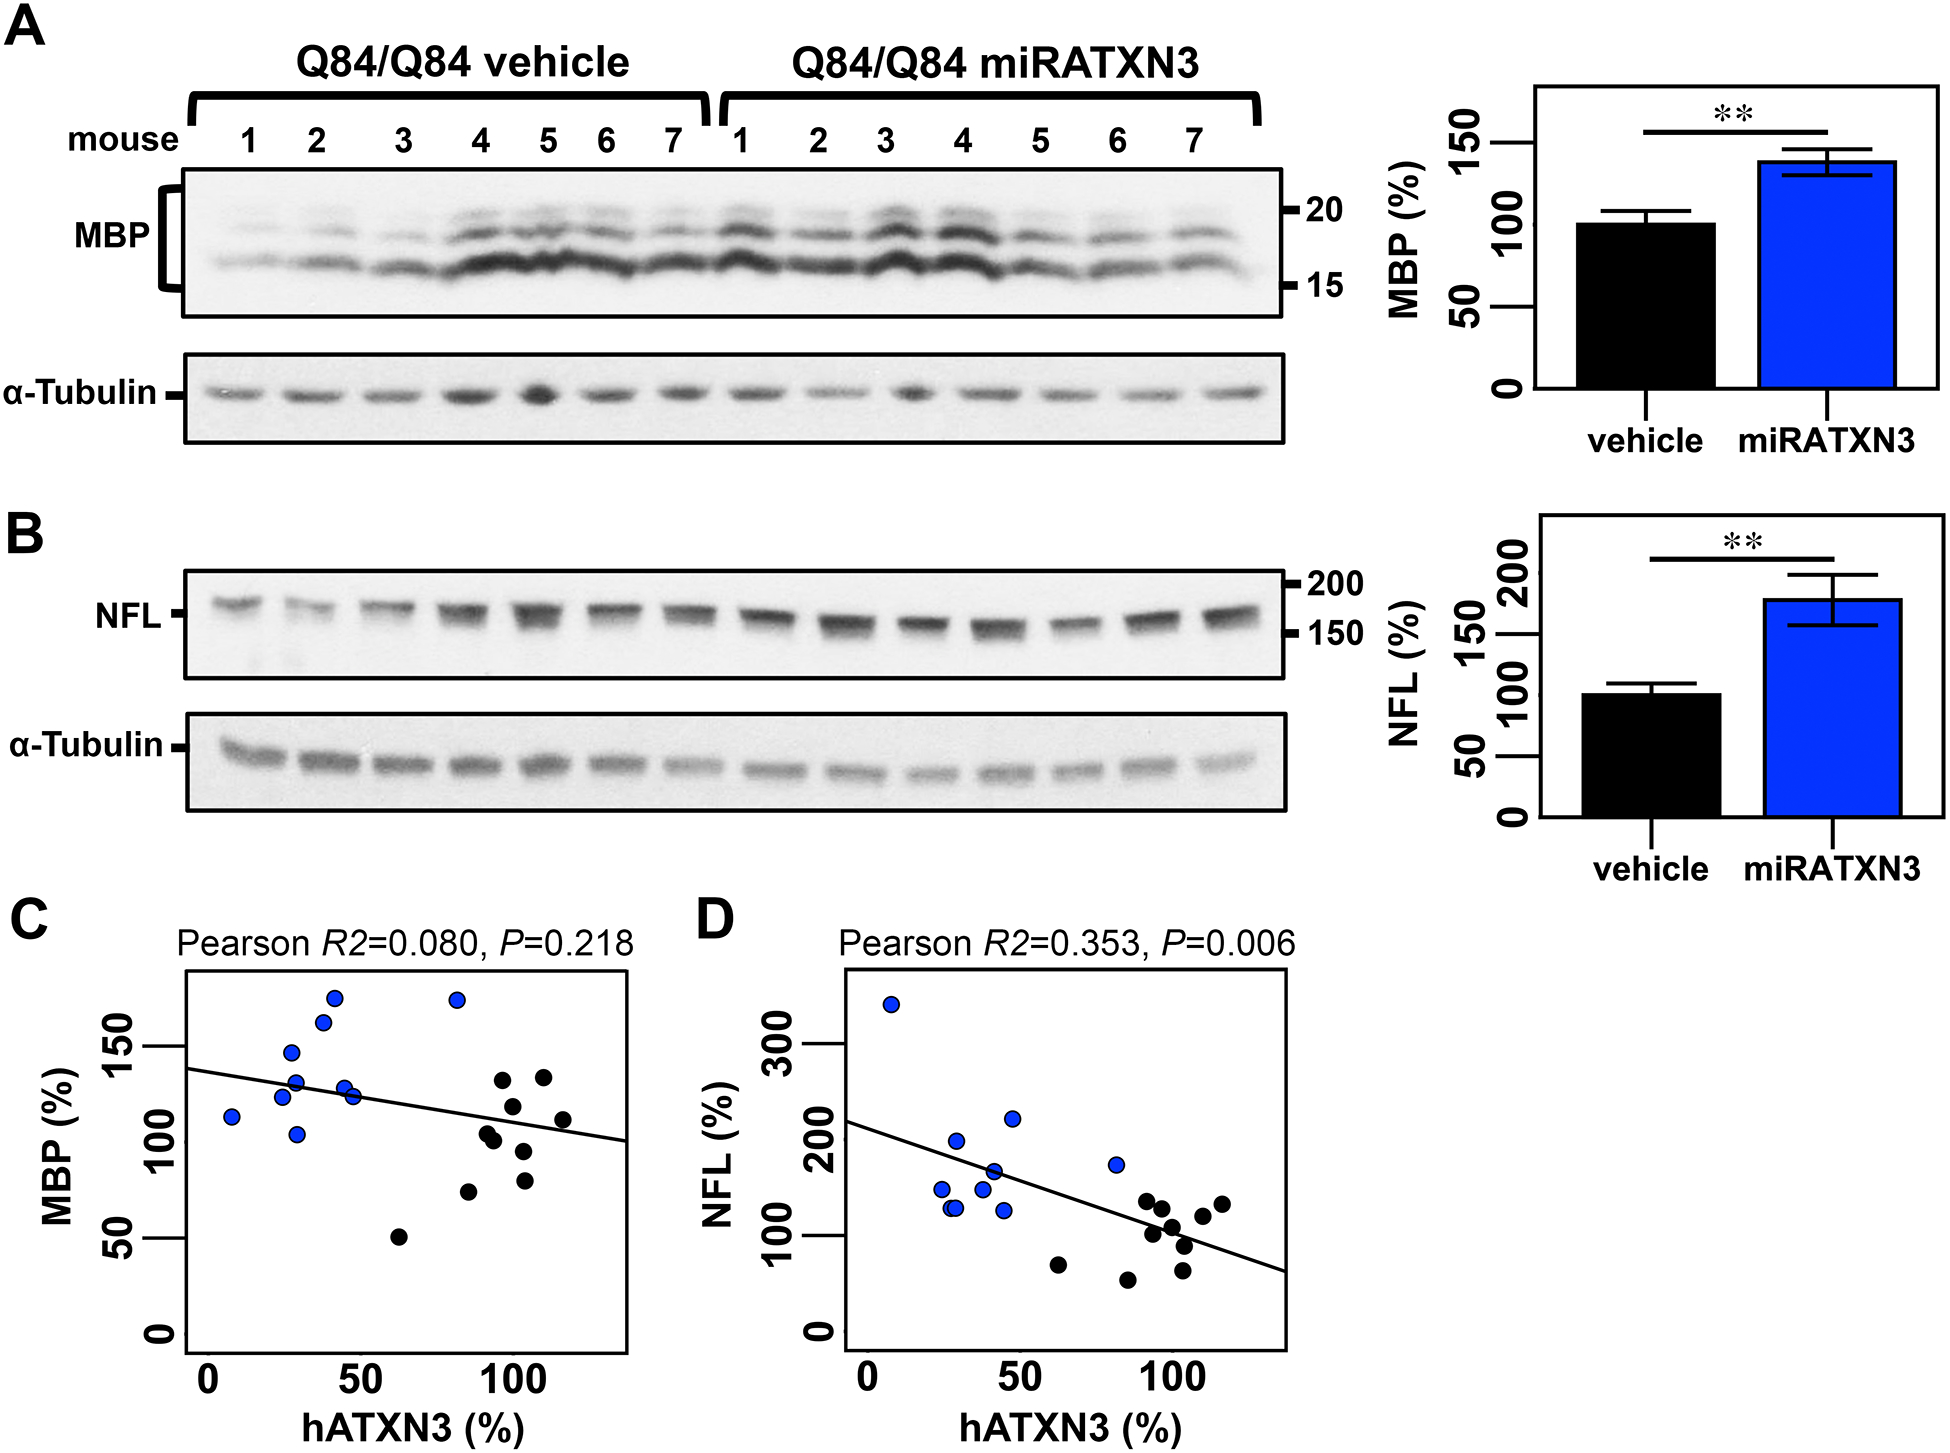
Immunoblotting to detect MBP (A) and NFL (B) in cerebellar soluble protein extracts from end-stage Q84/Q84 mice injected with an adeno-associated virus delivering an artificial microRNA targeting ATXN3 transcripts (miRATXN3) or injected with vehicle. Graphs show quantification of protein bands by densitometry. Bars represent the average percentage of protein relative to levels in vehicle-injected Q84/Q84 mice, normalized for a-Tubulin (± SEM). Black and blue bars indicate, respectively, vehicle-injected and miRATXN3-injected Q84/Q84 mice. Statistical significance determined by Student’s t-test is indicated as **P<0.01. Plots showing Pearson correlations of levels of MBP with hATXN3 (C) and of NFL with hATXN3 (D) in vehicle (black circles) or miRATXN3 (blue circles) treated Q84/Q84 mice.