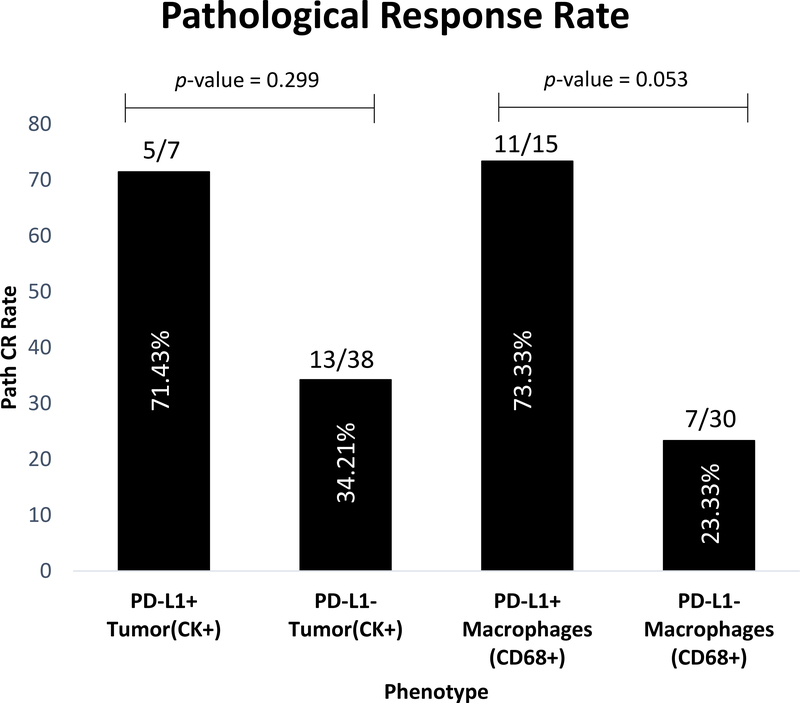
Figure 4.
A bar chart comparing the percentage of pCR as a function of PD-L1 expression in tumor cells as defined by the CK compartment and macrophages as defined by the CD68 compartment. A visual cut point was used to access PD-L1 Expression in tumor cells and macrophages. The visual cut-point is defined as the signal in the case were the signal can be seen “by eye”. Fisher’s Exact test was used to test for relationship between PD-L1 positive and PD-L1 negative patients in relation to pathological response.

