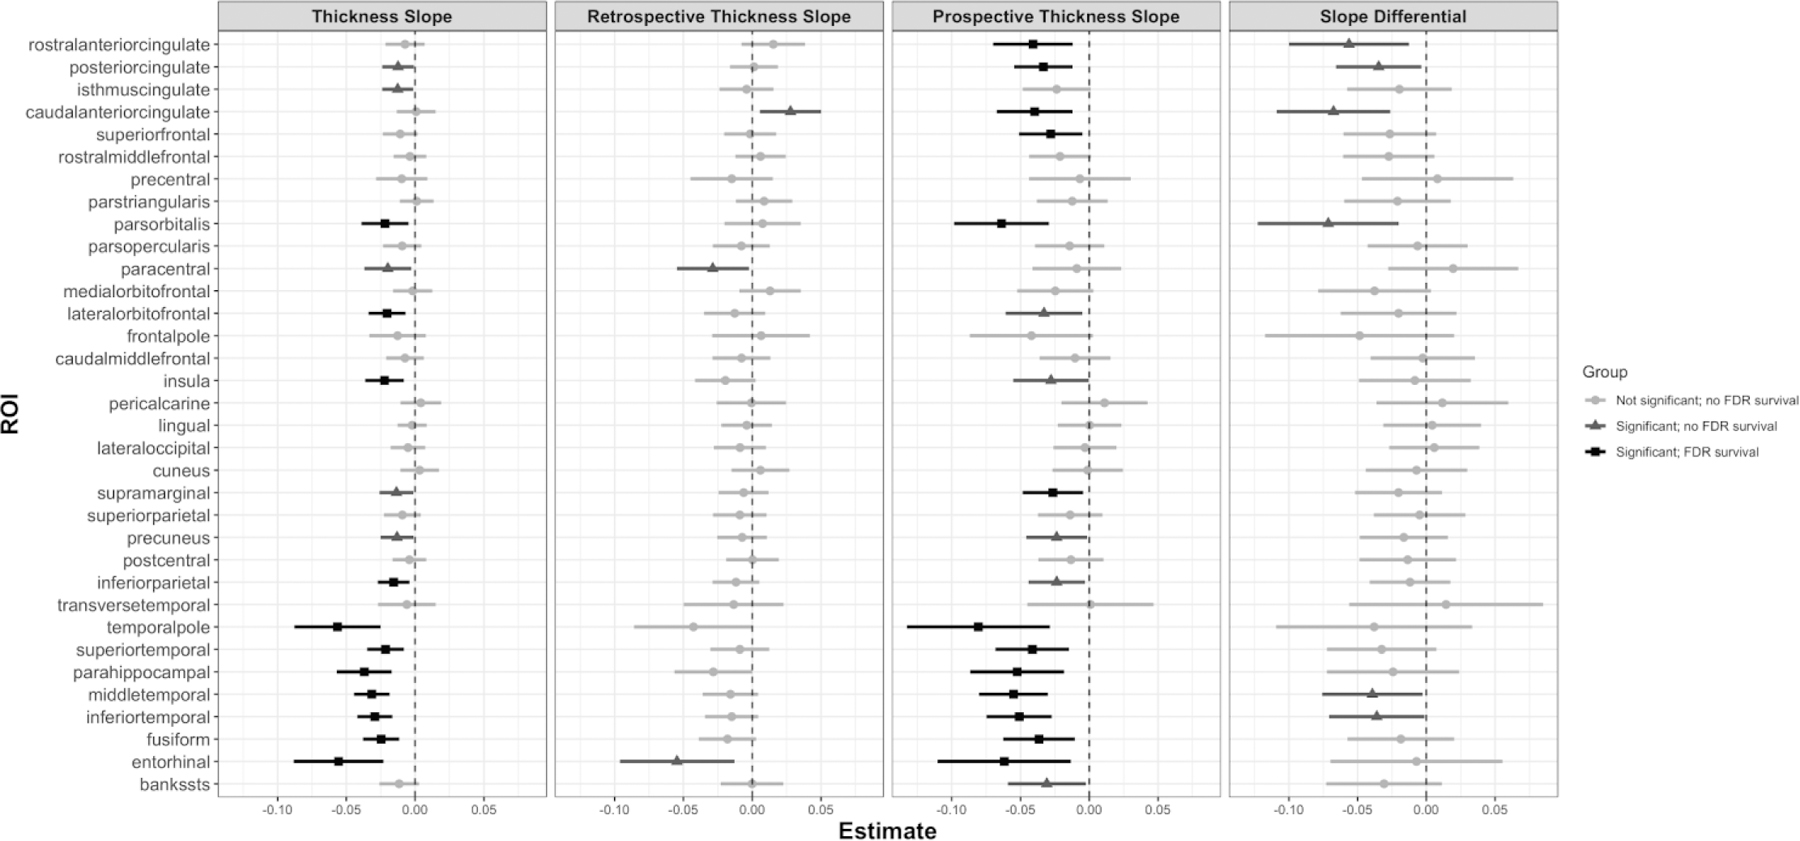
Fig. 1. IT FTP Effects.

Forest plots for IT FTP analyses with lines centered at their respective unstandardized estimate with 95% confidence intervals. Thickness Slope) IT FTP ✕ Time effect in Model 1, over the full observation period. Retrospective Thickness Slope) IT FTP:Time:G1 effect in Model 2B. Prospective Thickness Slope) IT FTP:Time:G2 effect in Model 2B. Slope Differential) IT FTP:Time:G effect in Model 2A, showing a comparison of retrospective versus prospective thickness slopes. Light gray indicates no significant effect, mild gray indicates a significant effect but no FDR survival, and black represents a significant effect with FDR survival. Abbreviations: FTP = flortaucipir; IT = inferior temporal gyrus; FDR = False Discovery Rate.
