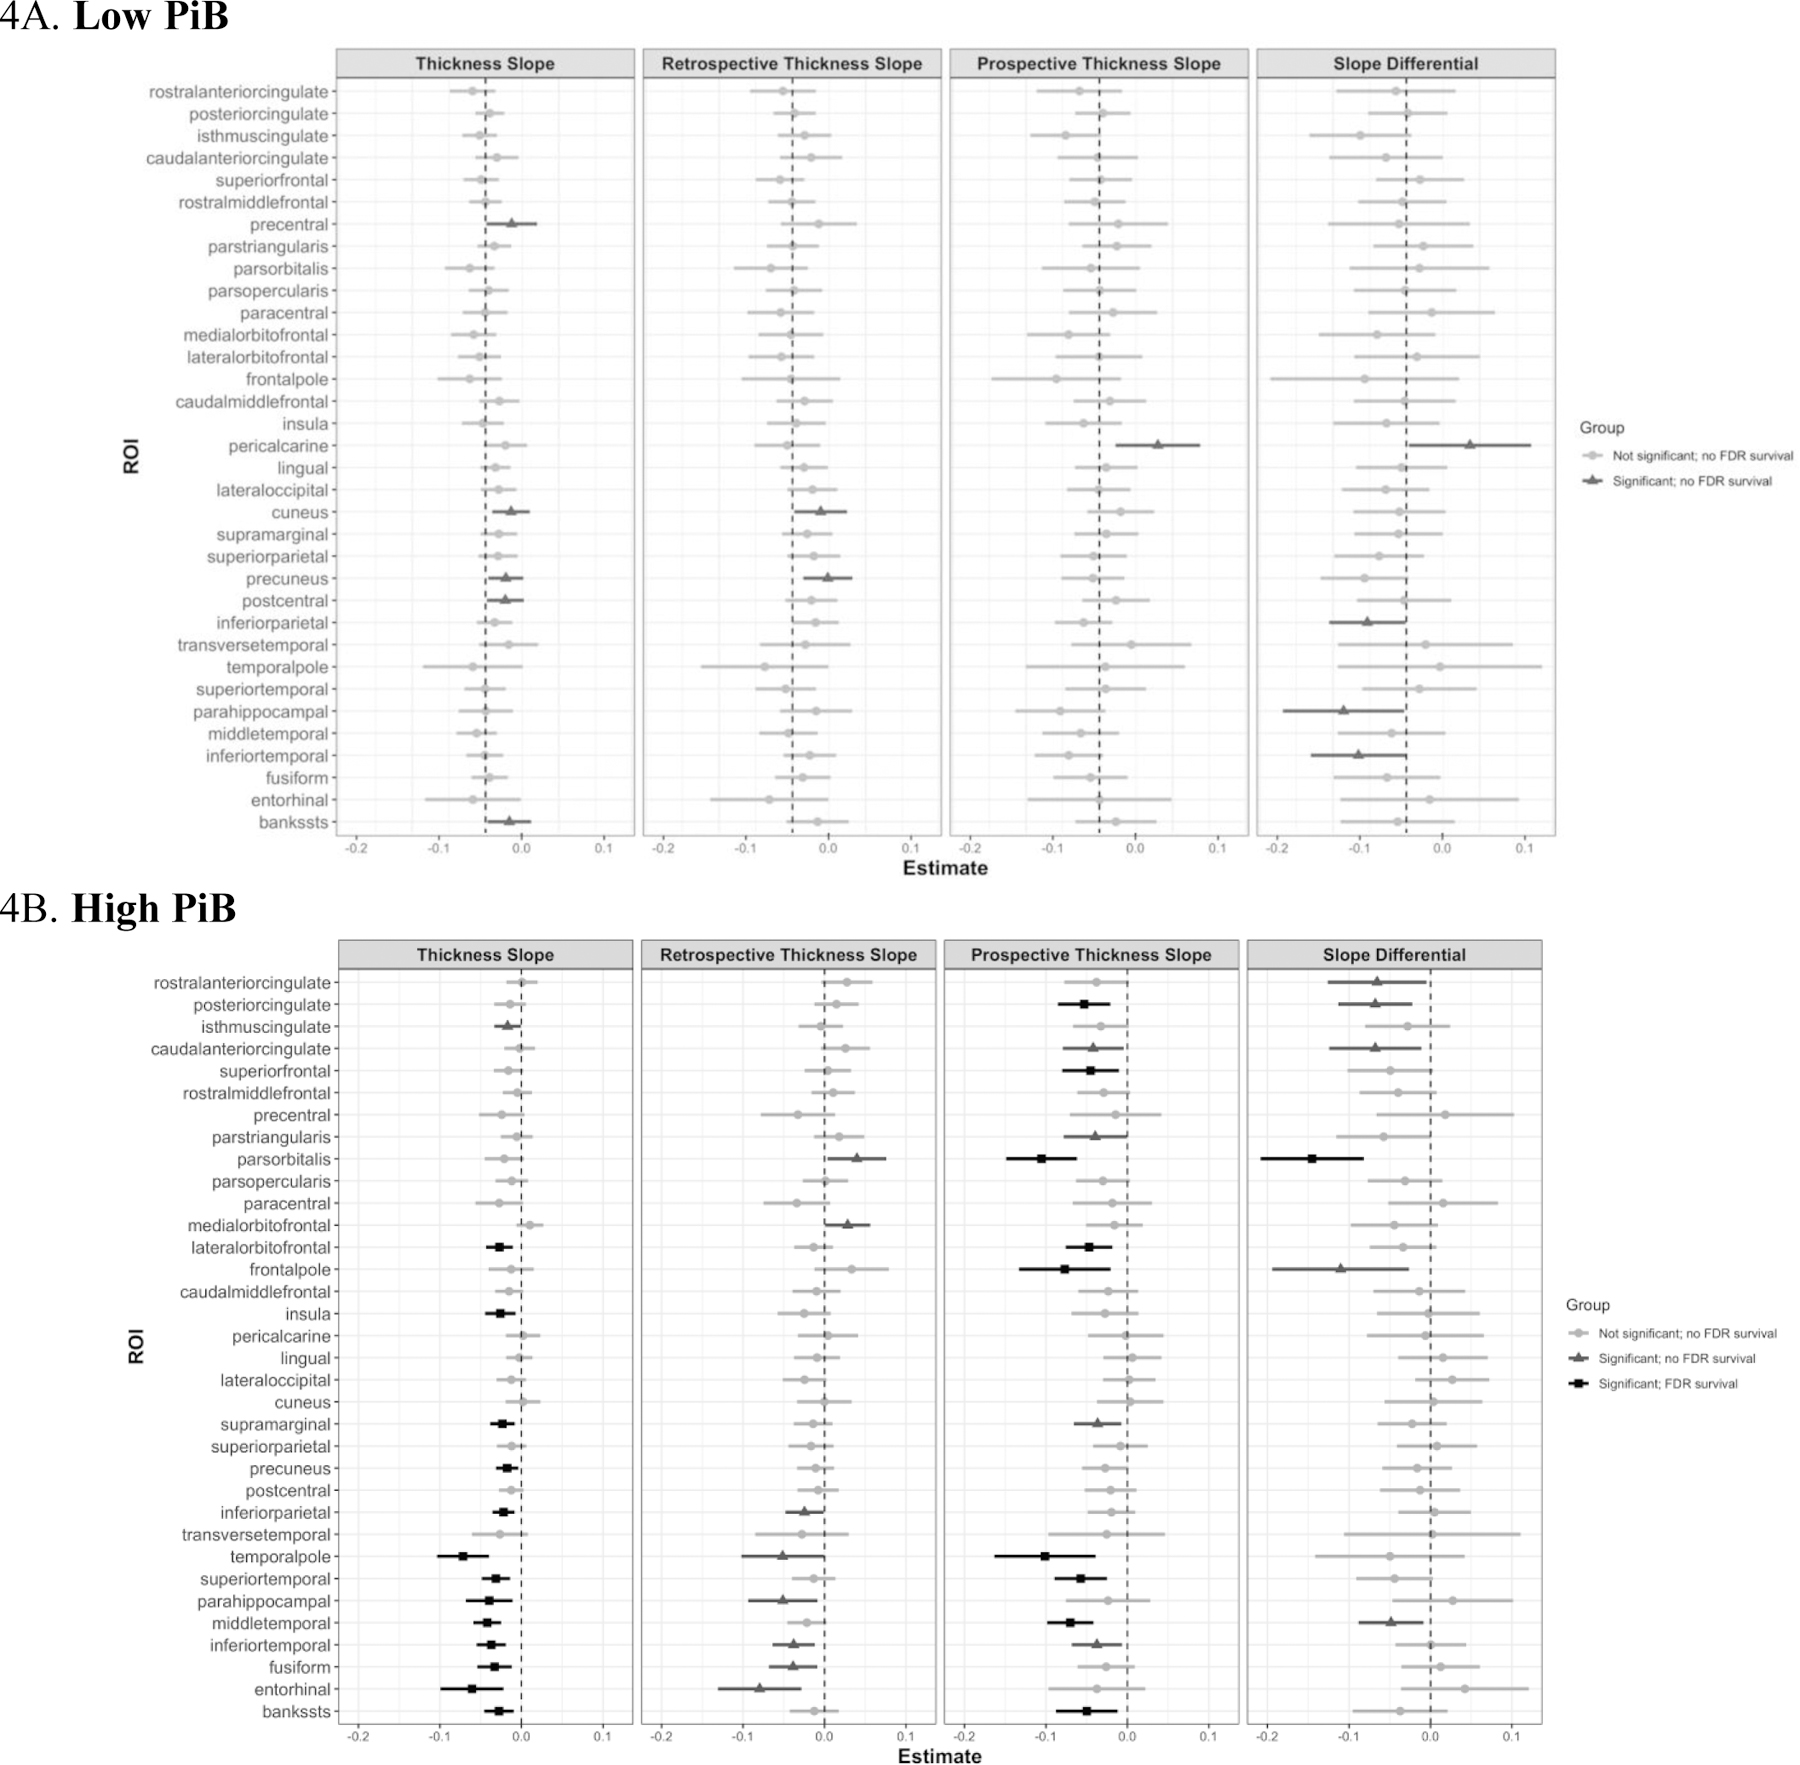
Fig. 4. IT FTP Effects in Low and High PiB Groups.

Forest plots of LME estimates for all ROIs are shown, with the sample stratified by PiB group. Bars are centered at their respective beta estimate (unstandardized) with 95% confidence intervals. Moreover, light gray indicates no significant effect, mild gray indicates a significant effect but no FDR survival, and black represents a significant effect with FDR survival. Abbreviations: FTP = flortaucipir; IT = inferior temporal gyrus; EC = entorhinal cortex; PiB = Pittsburgh compound B; FDR = False Discovery Rate.
