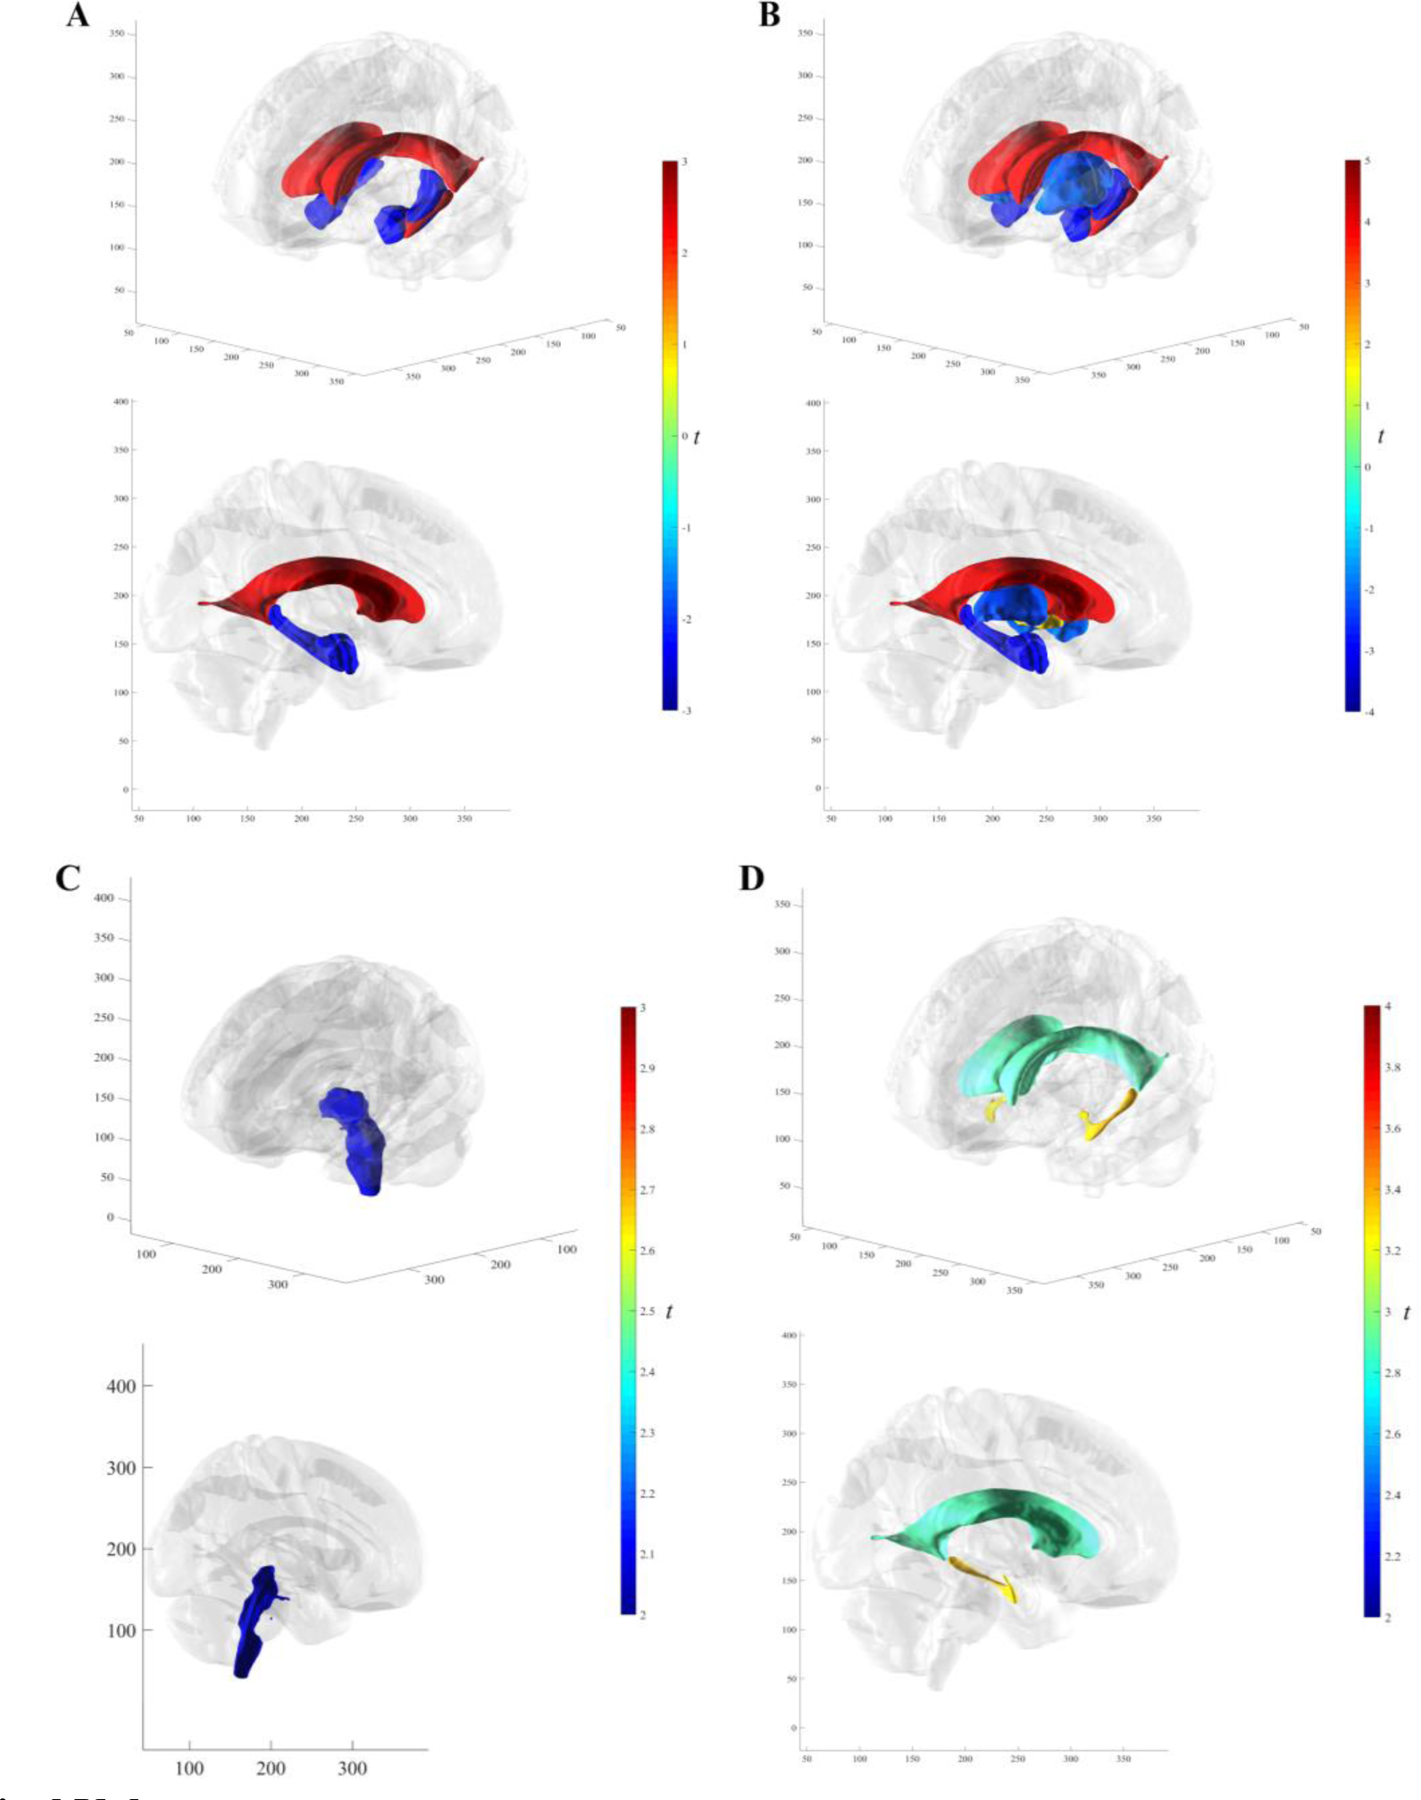
Fig. 5. Subcortical Volume.

3D brain renderings of significant (no FDR correction) IT SUVr t-statistics. In order of increasing magnitude (A) Subcortical volume over the full follow-up range in the hippocampus, lateral ventricles, amygdala, and inferior lateral ventricles. (B) Prospective subcortical volume in the pallidum, putamen, thalamus proper, amygdala, hippocampus, lateral ventricles, and inferior lateral ventricles. (C) Retrospective subcortical volume in the brain stem. (D) Slope differences between retrospective and prospective thickness in the lateral and inferior lateral ventricles. Abbreviations: IT = inferior temporal gyrus; SUVr = standardized uptake value ratio; FTP = flortaucipir; FDR = False Discovery Rate.
