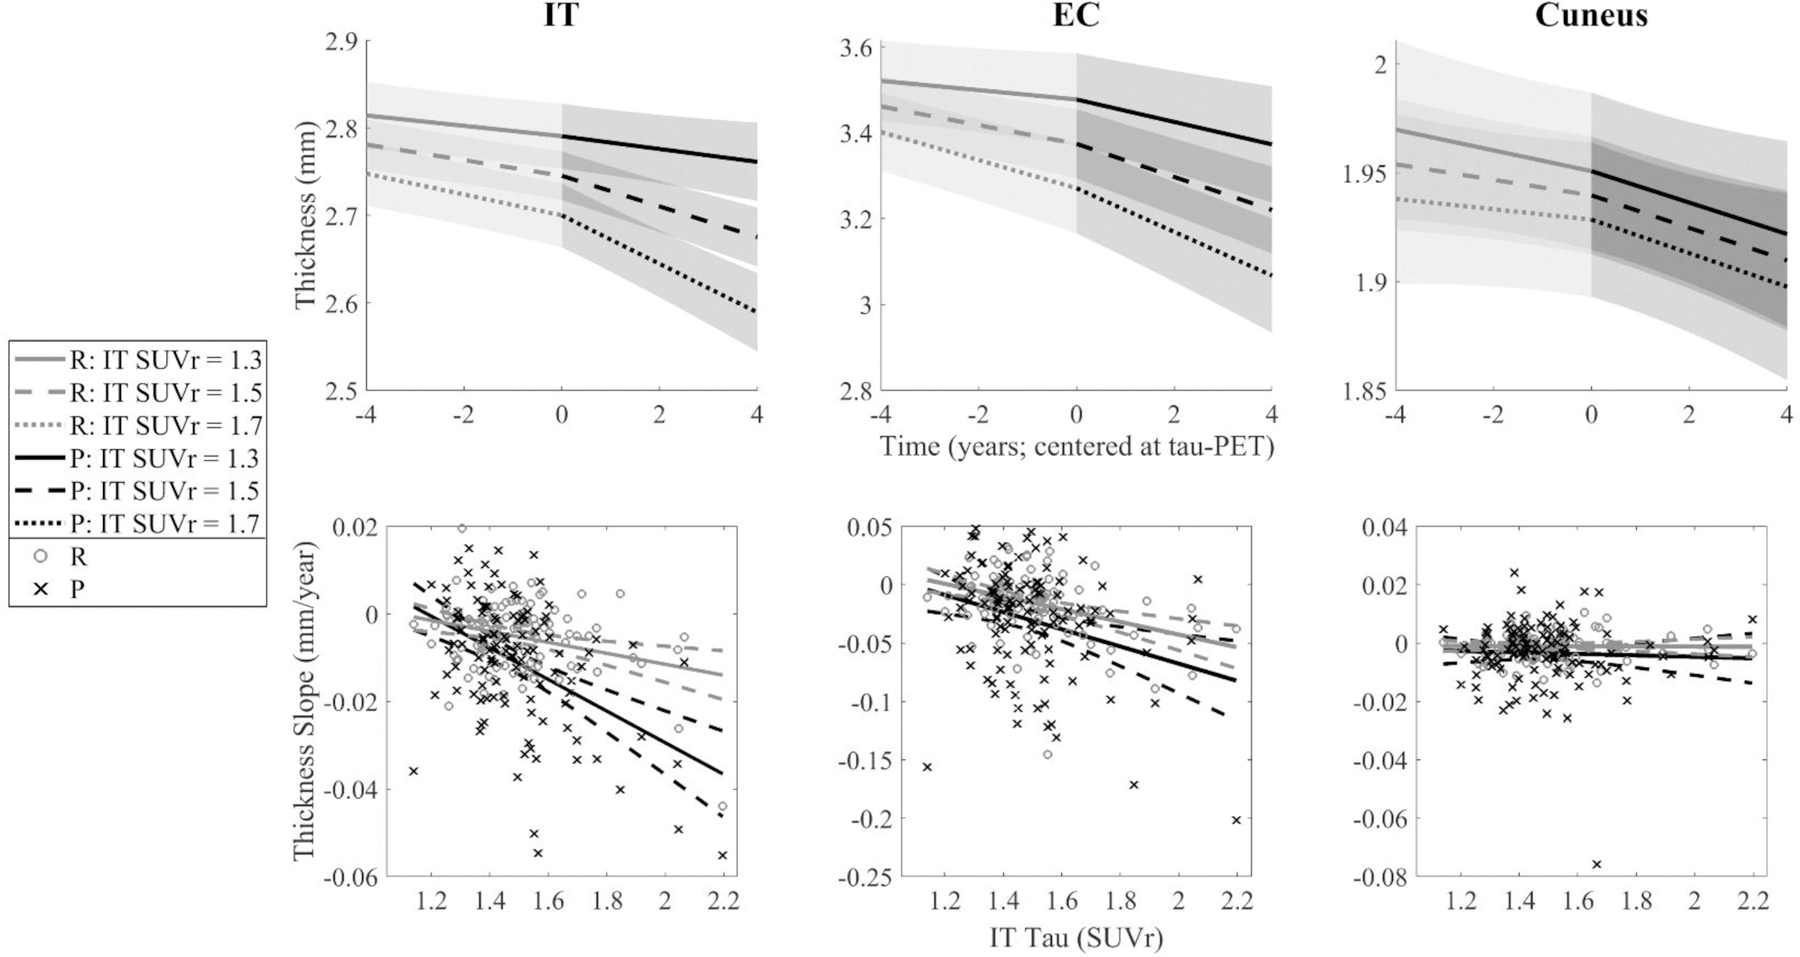
Fig. 6. The Influence of IT Tau on Cortical Thinning in Three Regions.

(Top Row) IT, EC, and cuneus thinning are modeled at three levels of IT tau-PET (SUVr = 1.3, 1.5, and 1.7; median = 1.46) using estimates from Model 2A. (Bottom Row) Retrospective (gray o’s) and prospective (black x’s) thickness slopes are plotted against IT tau-PET signal. Slopes shown are representations of models analyzed, not direct reflections, as slopes were extracted by independent random effects of the equation: Thickness ~ 1 + (1|Participant) + (Time:Retrospective Indicator – 1|Participant) + (Time:Prospective Indicator – 1|Participant). Abbreviations: IT = inferior temporal gyrus; EC = entorhinal cortex; SUVr = standardized uptake value ratio; FTP = flortaucipir.
