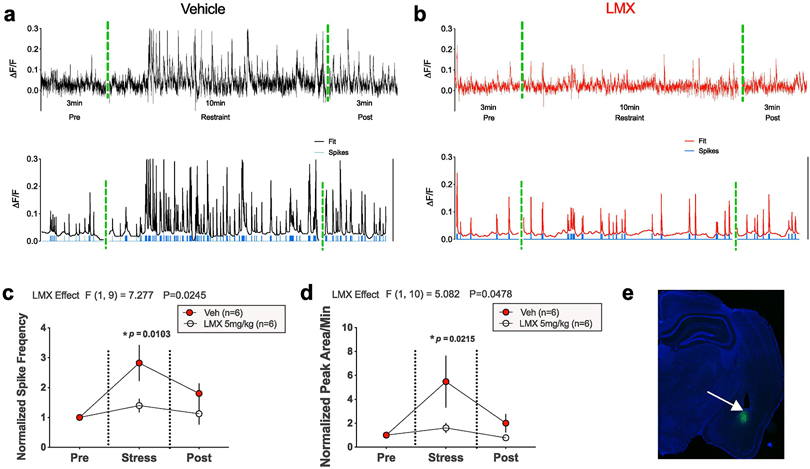
Figure 2. LMX prevents increased BLA activity during acute restraint stress in male mice.

Representative traces showing changes in AF/F calcium signaling as a function of time in the BLA before, during, and immediately after acute restraint stress, in mice treated with vehicle (a top) or LMX (b top). Representative traces of filtered calcium signals and calculated action potentials underlying recorded calcium fluorescence (blue tick marks), generated using MATLAB MLspike algorithm, are shown in (a-b bottom), (c-d) Effects of LMX 5mg kg−1 on normalized spike frequency and total peak AUC as a function of time before, during, and after acute stress, (e) GCaMP7f expression in the BLA (in green, 5x magnification). Data were normalized to pre-stress time periods for all mice (baseline value of 1). P-values represent significance levels obtained via Holm-Sidak pairwise comparisons test after Two-way repeated measures ANOVA (F values shown above panels), with number of subjects per group as follows: Vehicle n=6 mice, LMX n=6 mice.
