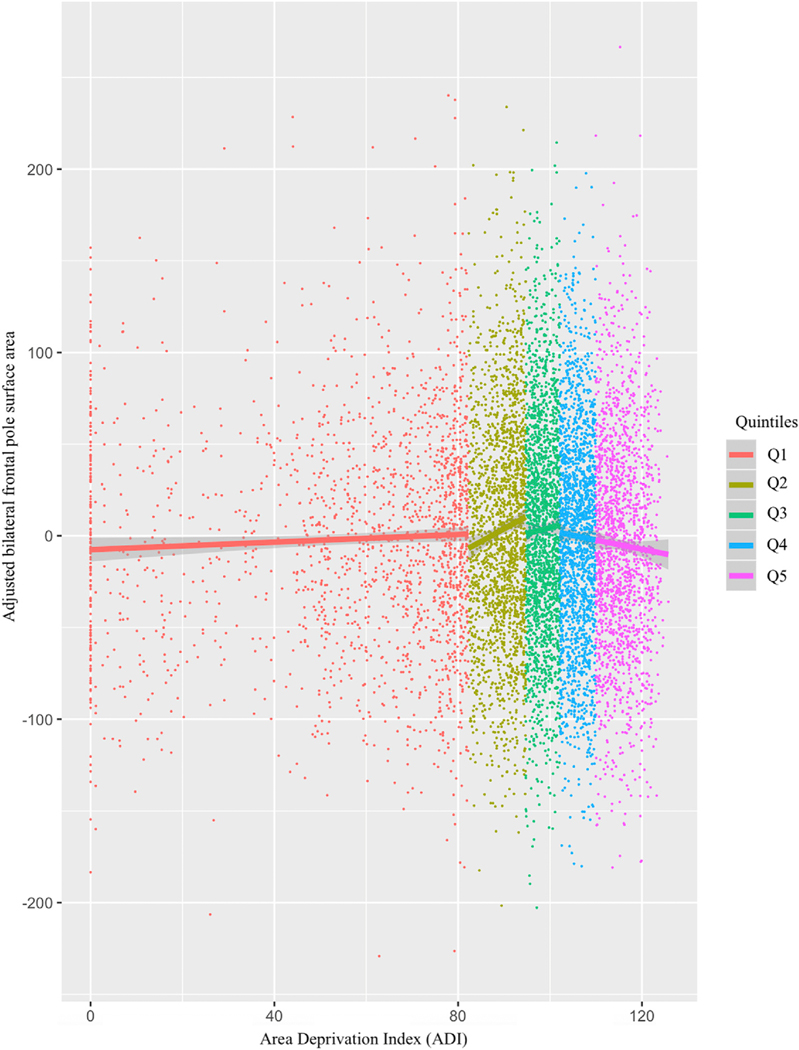
Fig. 3.
Bilateral frontal pole surface area plotted according to individual Area Deprivation Index (ADI) values used to sort participants into quintiles (color-coded to the right). The highest deprivation quintile (Q5) shows smaller surface area relative to Q2 and Q3, pBonferroni < 0.05. Adjusted area values constitute estimated marginal means partialling out age, sex, a whole brain correction, weight, parental education, and household income.

