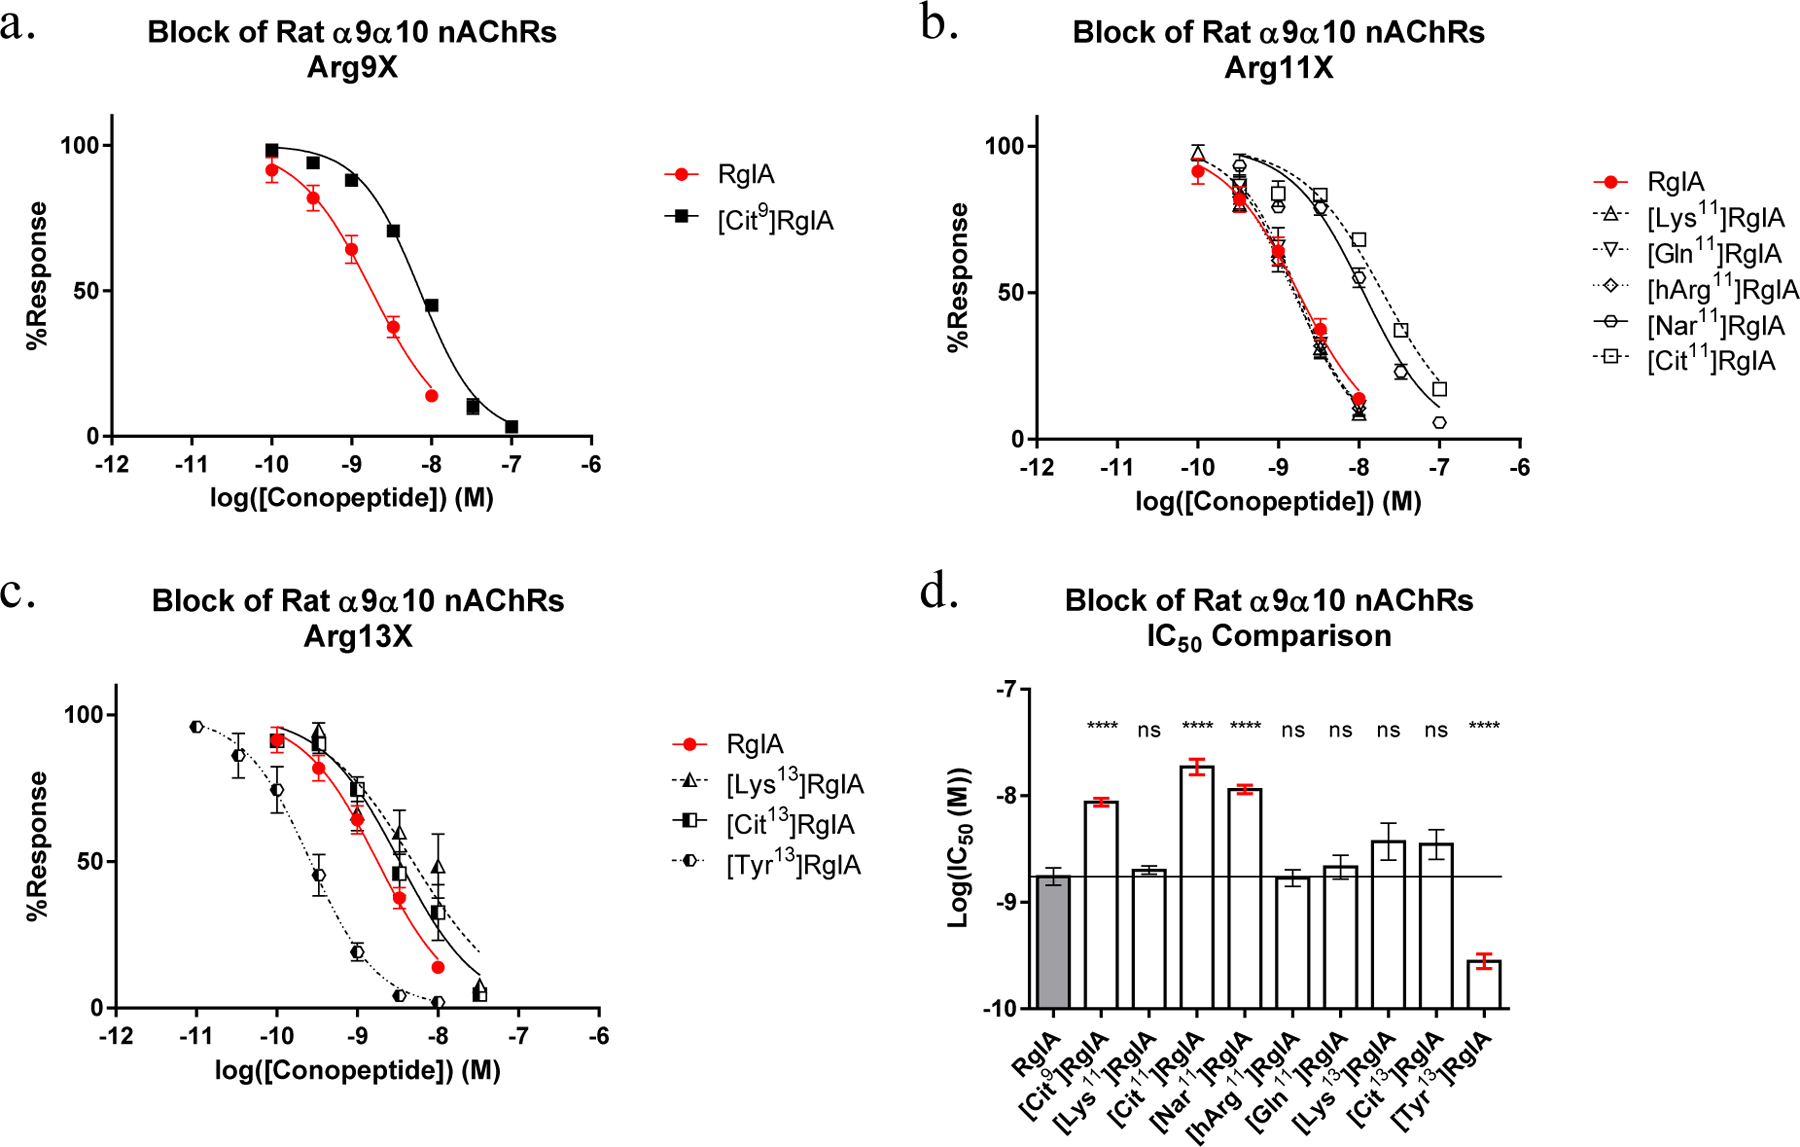
Figure 3:

Dose response curves of (a) Arg9 substitutions. Not pictured [hArg9] and [Nar9]RgIA, both of which yielded IC50 values >1000 nM, (b) Arg11 substitutions, and (c) Arg13 substitutions, as obtained by two electrode voltage clamp. (d) The calculated IC50s were compared to RgIA using ordinary one-way ANOVA followed by a Dunnett’s multiple comparison test. Each data point represents at least three replicate samples accompanied with the standard error of the mean.
