
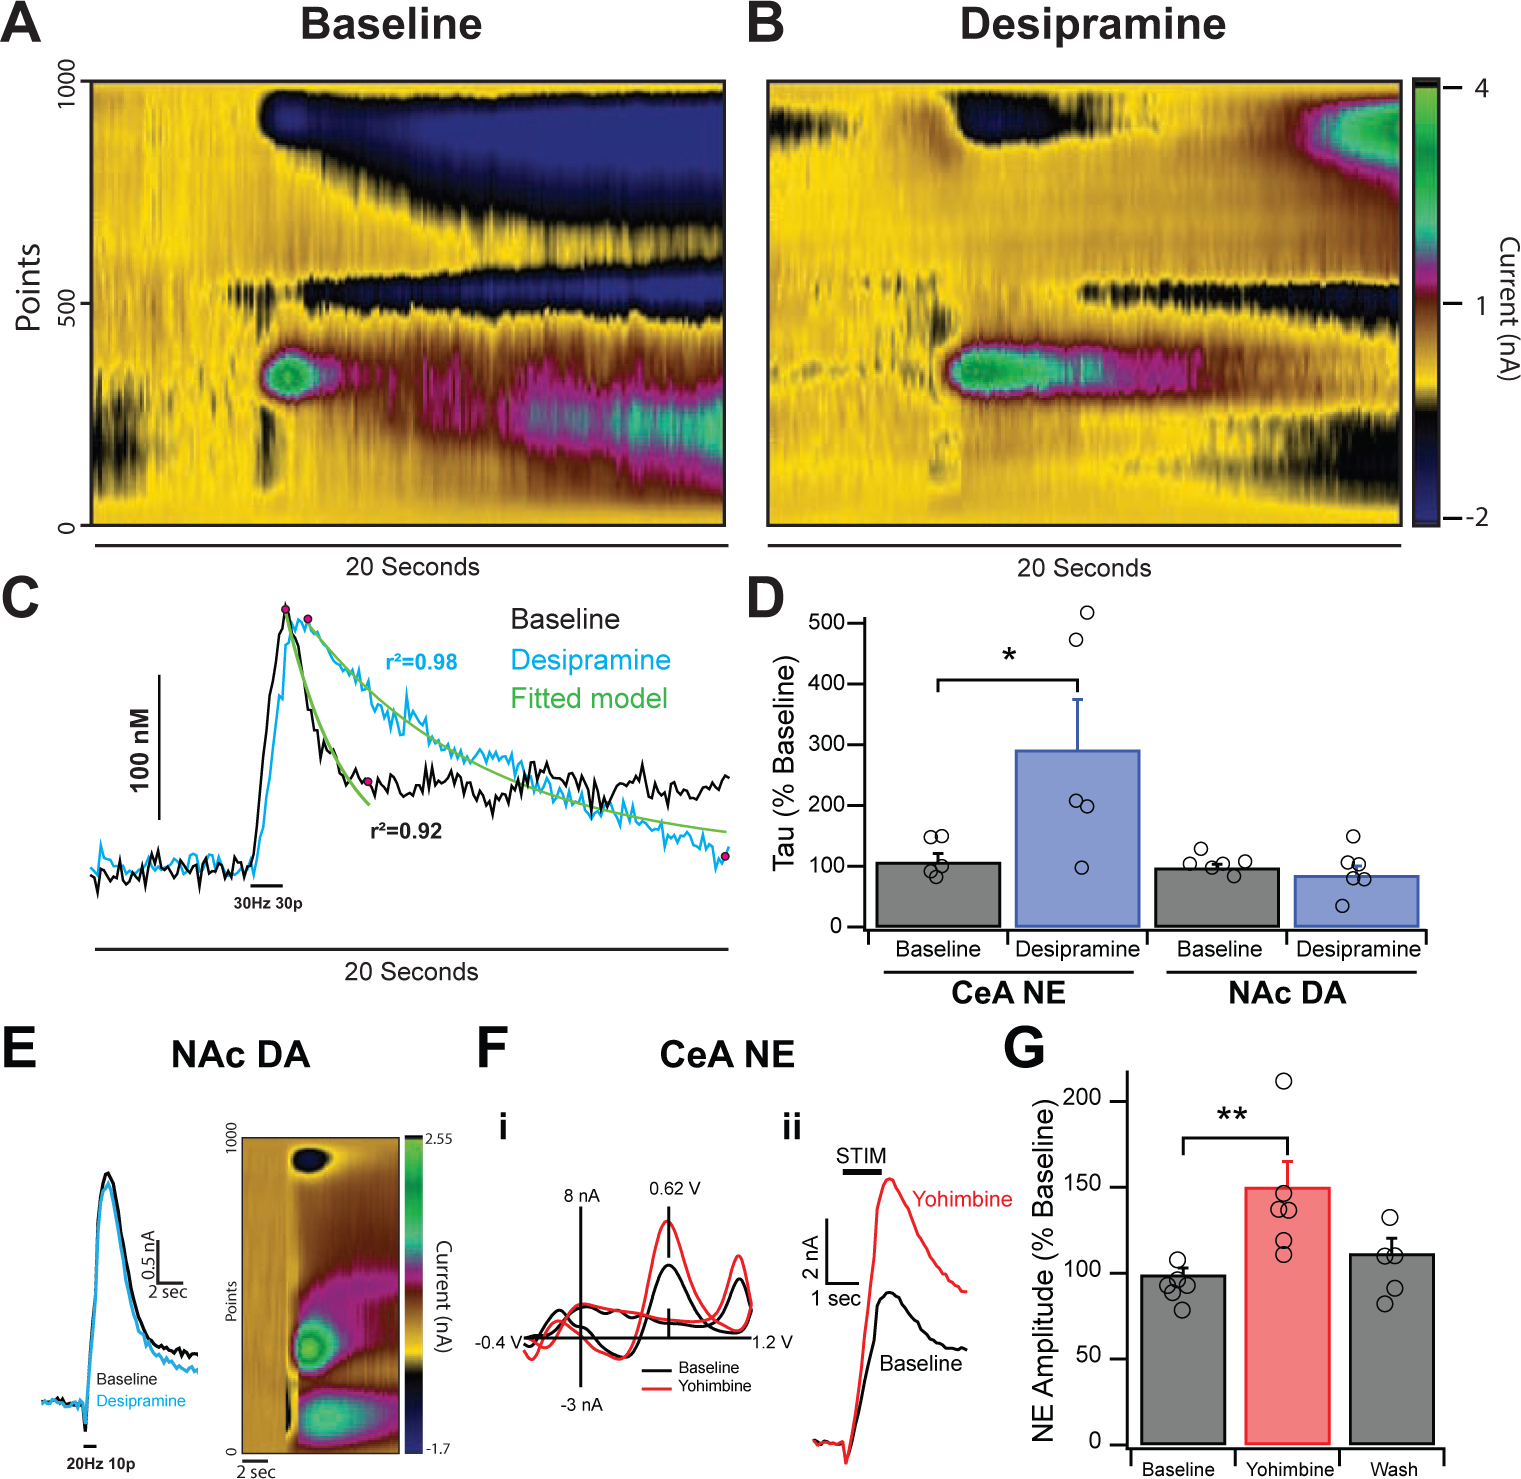
Figure 1: Effects of Desipramine and Yohimbine on Evoked NE Release in the CeA.
A&B. Colorplots depicting electrically evoked (30 Hz 30 pulse) NE release in the CeA before and after desipramine (50 μM). Stimulation triggers rapid release of neurotransmitter, which peaks and levels decay slowly to baseline. C. Current vs Time traces from colorplots in A&B at peak oxidation potentials. Traces were modeled using a single exponential fit before and after desipramine. Curve fits (shown in green) were based off a region of interest between the peak response and where the initial decay had stabilized (highlighted with pink dots). Reuptake times were calculated by averaging the half-life constant tau. D. Desipramine increased reuptake times of NE signals (left) to approximately 290% of baseline without affecting peak height. Desipramine failed to increase the half-life constant for exclusively DA signals (right) in the striatum. E. Stimulated DA release in the NAc showing no effect of desipramine on reuptake. F. Inset i shows the characteristic voltammogram of NE with a primary oxidative peak at 0.62 V and Yohimbine’s effects on NE release. Amplitude of this peak is directly correlated with volume of NE released from tissue. Inset ii shows current vs time plots of electrically-evoked NE release. G. Yohimbine (25 μM) increased the NE signal to approximately 150% of baseline levels, an effect that washed out after removal of drug. Error bars represent the SEM and * and ** indicate a significance level of p < 0.05 and 0.01 respectively.