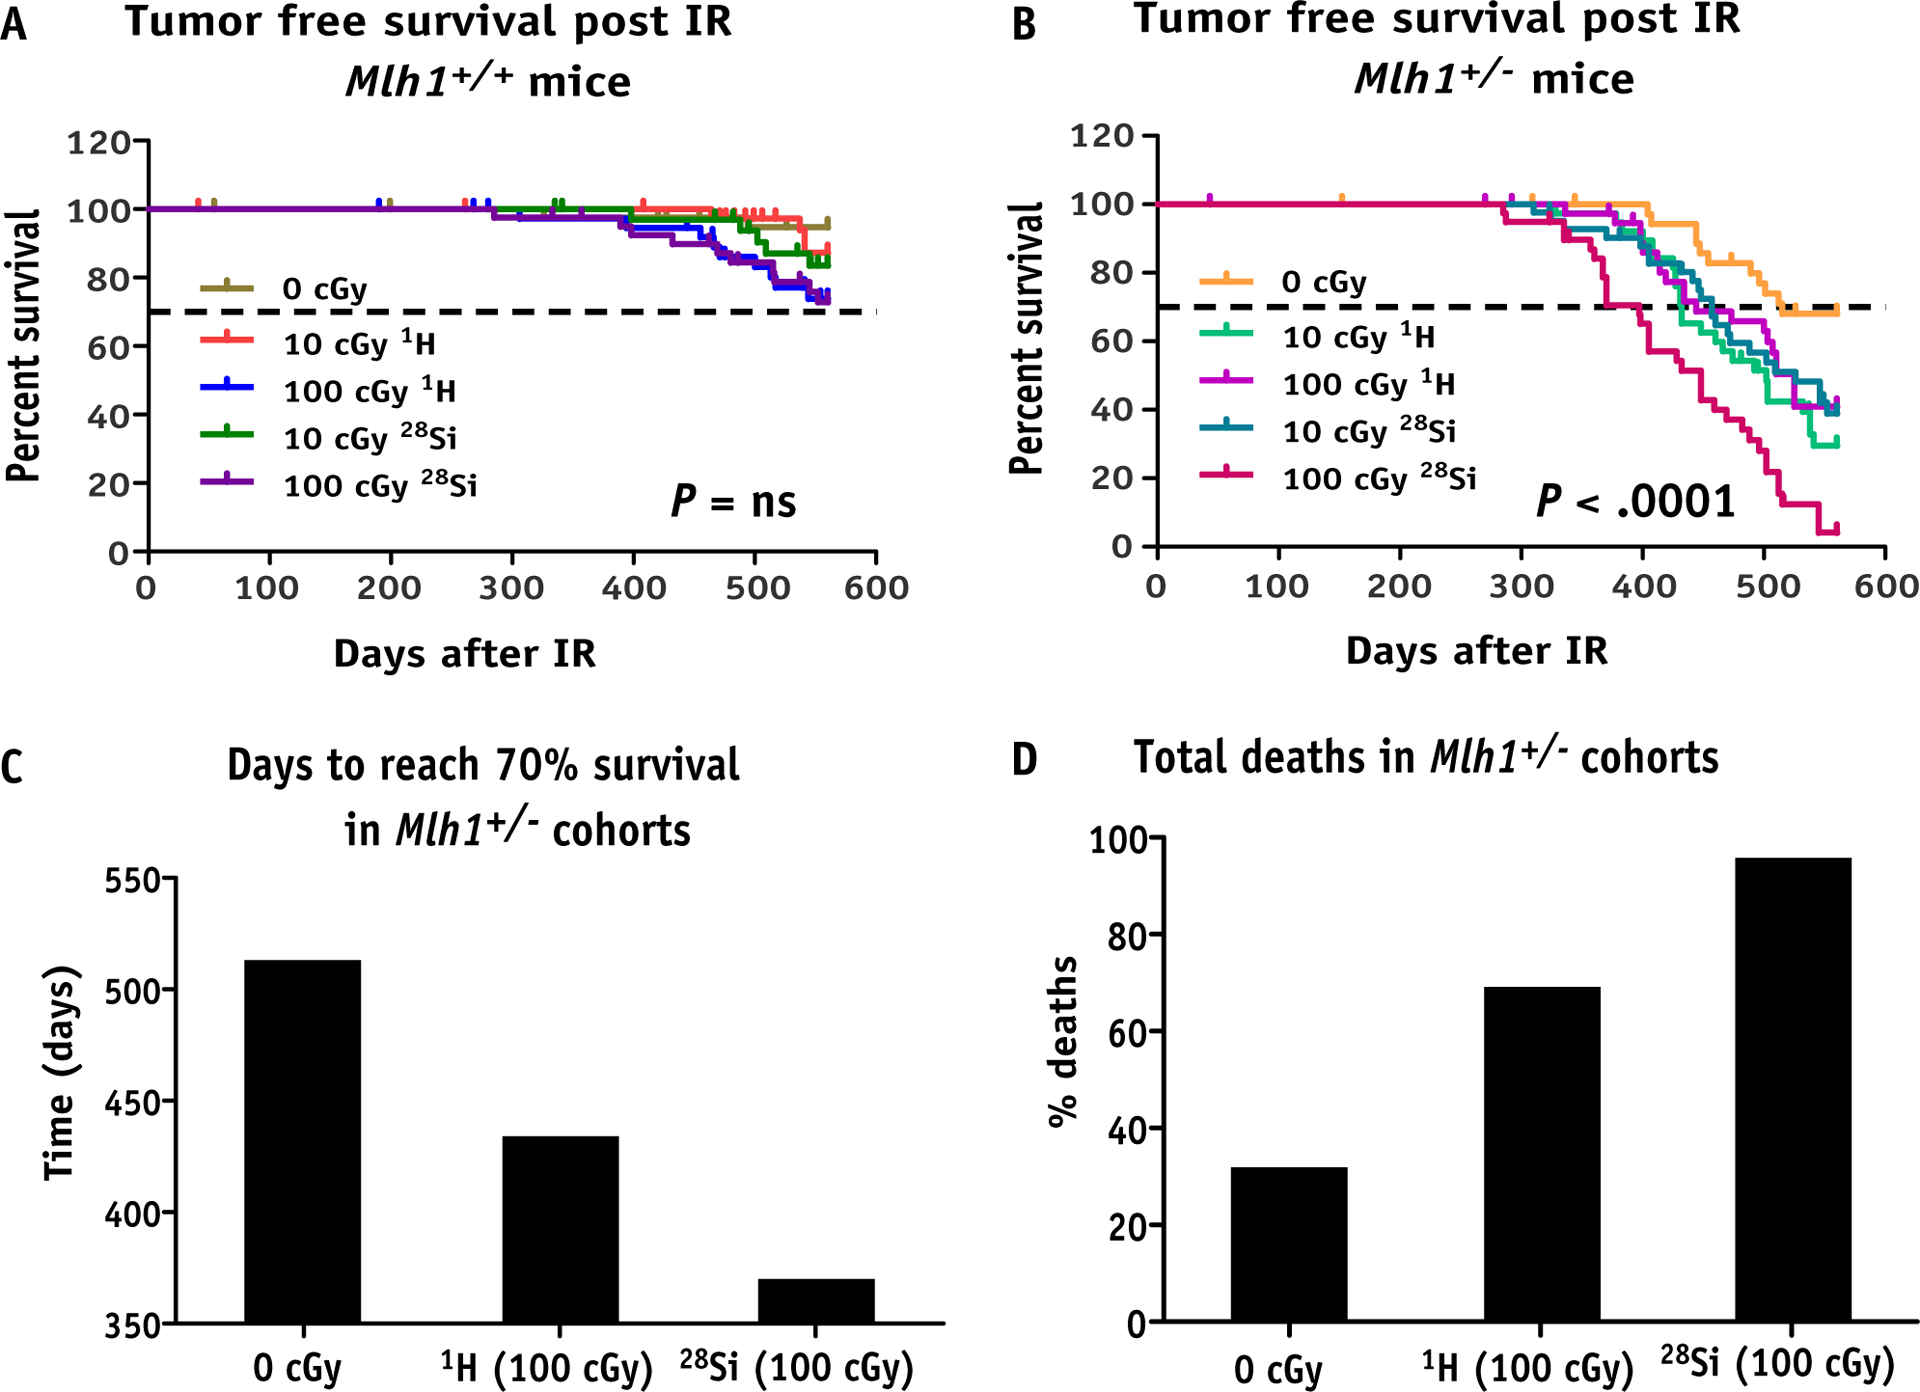
Fig. 1.

Long-term tumorigenesis assay post irradiation. (A) Schematic representation of assay design. (B) Kaplan-Meier plot represents tumor-free survival of Mlh1+/+ mice post 10 or 100 cGy of 1H or 28Si ion irradiation (n = 36–44, number of Mlh1+/+ mice used for each radiation exposure group). (C) Kaplan-Meier plot represents tumor-free survival of Mlh1+/− mice post 10 or 100 cGy of 1H or 28Si ion irradiation (n = 36–42, number of Mlh1+/− mice used for each radiation exposure group). (D) Bar graph represents the number of days to reach 70% survival in each Mlh1+/− cohort irradiated with sham, 100 cGy of 1H ions, or 100 cGy of 28Si ions. (E) Bar graph represents the percentage of death occurred in each Mlh1+/− cohort irradiated with sham, 100 cGy 1H ions, or 100 cGy 28Si ions. P values in each Kaplan-Meier plot were determined by log-rank (Mantel-Cox) test. Abbreviations: IR = ionizing radiation; ns = nonsignificant.
