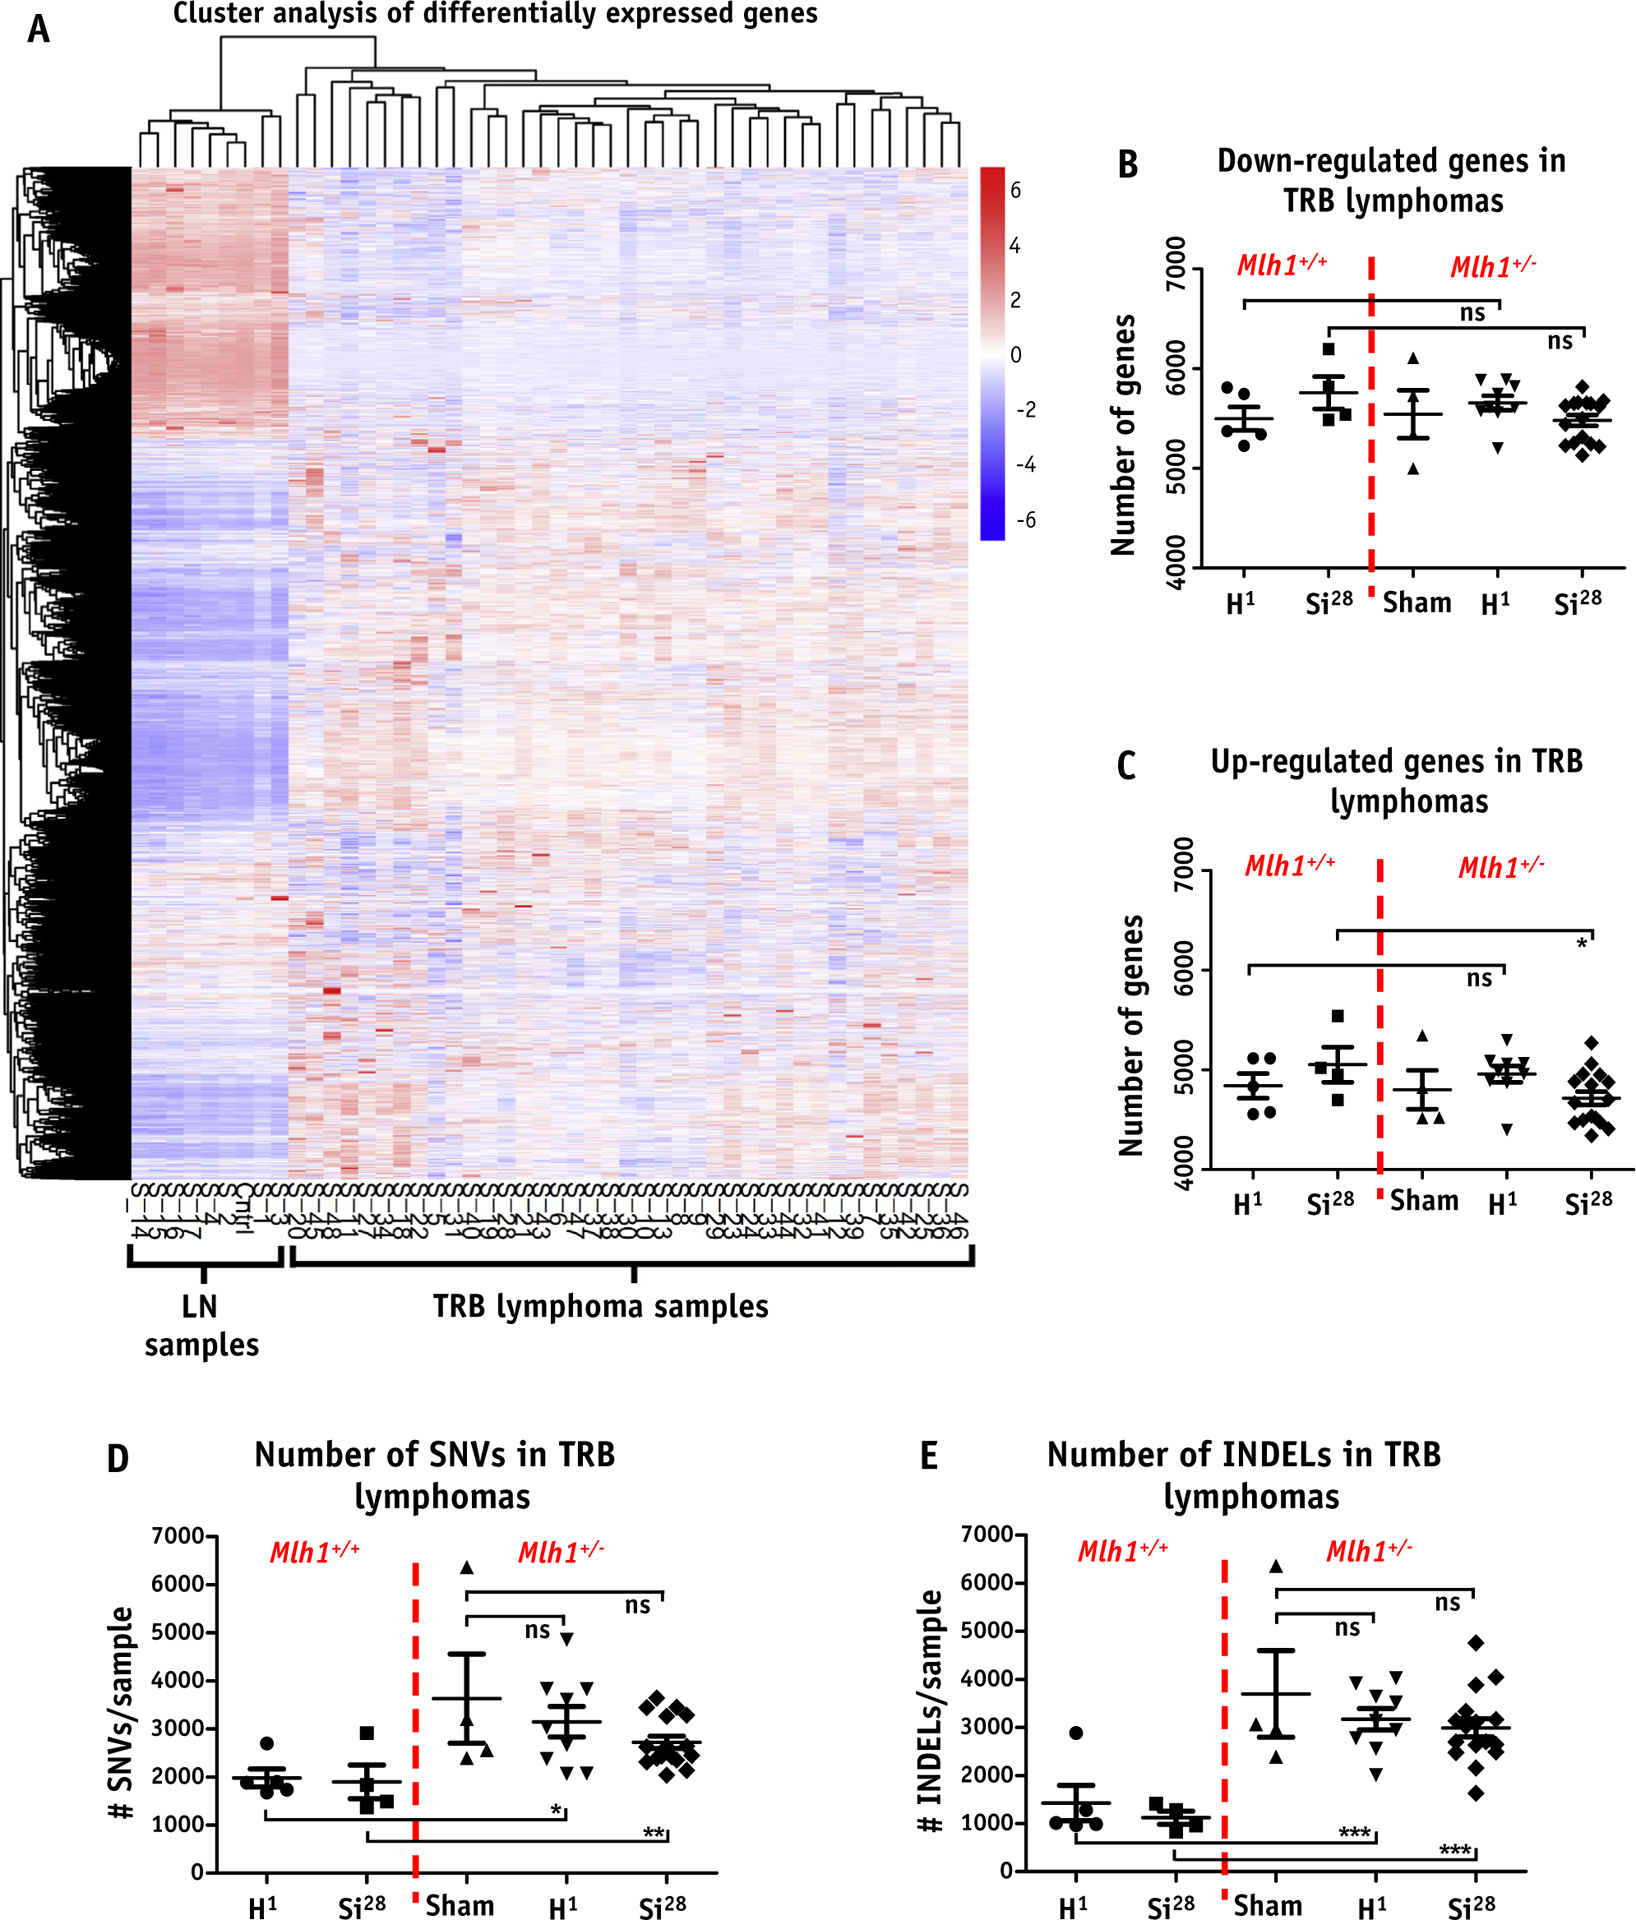
Fig. 3.

RNA sequencing analysis of T-cell rich B-cell (TRB) lymphomas. (A) Heatmap represents gene expression level of each TRB lymphoma arising from sham (n = 4, Mlh1+/−), 1H ion IR (n = 5 and 9 for Mlh1+/+ and Mlh1+/−, respectively), or 28Si ion IR (n = 4 and 16 for Mlh1+/+ and Mlh1+/−, respectively) compared with age-matched normal lymph node (n = 4 and 4 for Mlh1+/+ and Mlh1+/−, respectively) in the form of hierarchical clustering. Number of genes (B) downregulated, and (C) upregulated, in each TRB lymphoma arising from either Mlh1+/+ or Mlh1+/− mice post sham, 1H ion, or 28Si ion irradiation. (D) Number of single nucleotide variants and TRB lymphoma. (E) Number of insertions and deletions and TRB lymphoma in each cohort of Mlh1+/+ and Mlh1+/− mice post sham, 1H ion, or 28Si ion irradiation. P values were determined by unpaired t tests; ) = P < .05, )) = P < .01, ))) = P < .001. Abbreviations: INDEL = insertions and deletions; ns = nonsignificant; SNV = single nucleotide variants; TRB = T-cell rich B-cell.
