
Fig. 4.
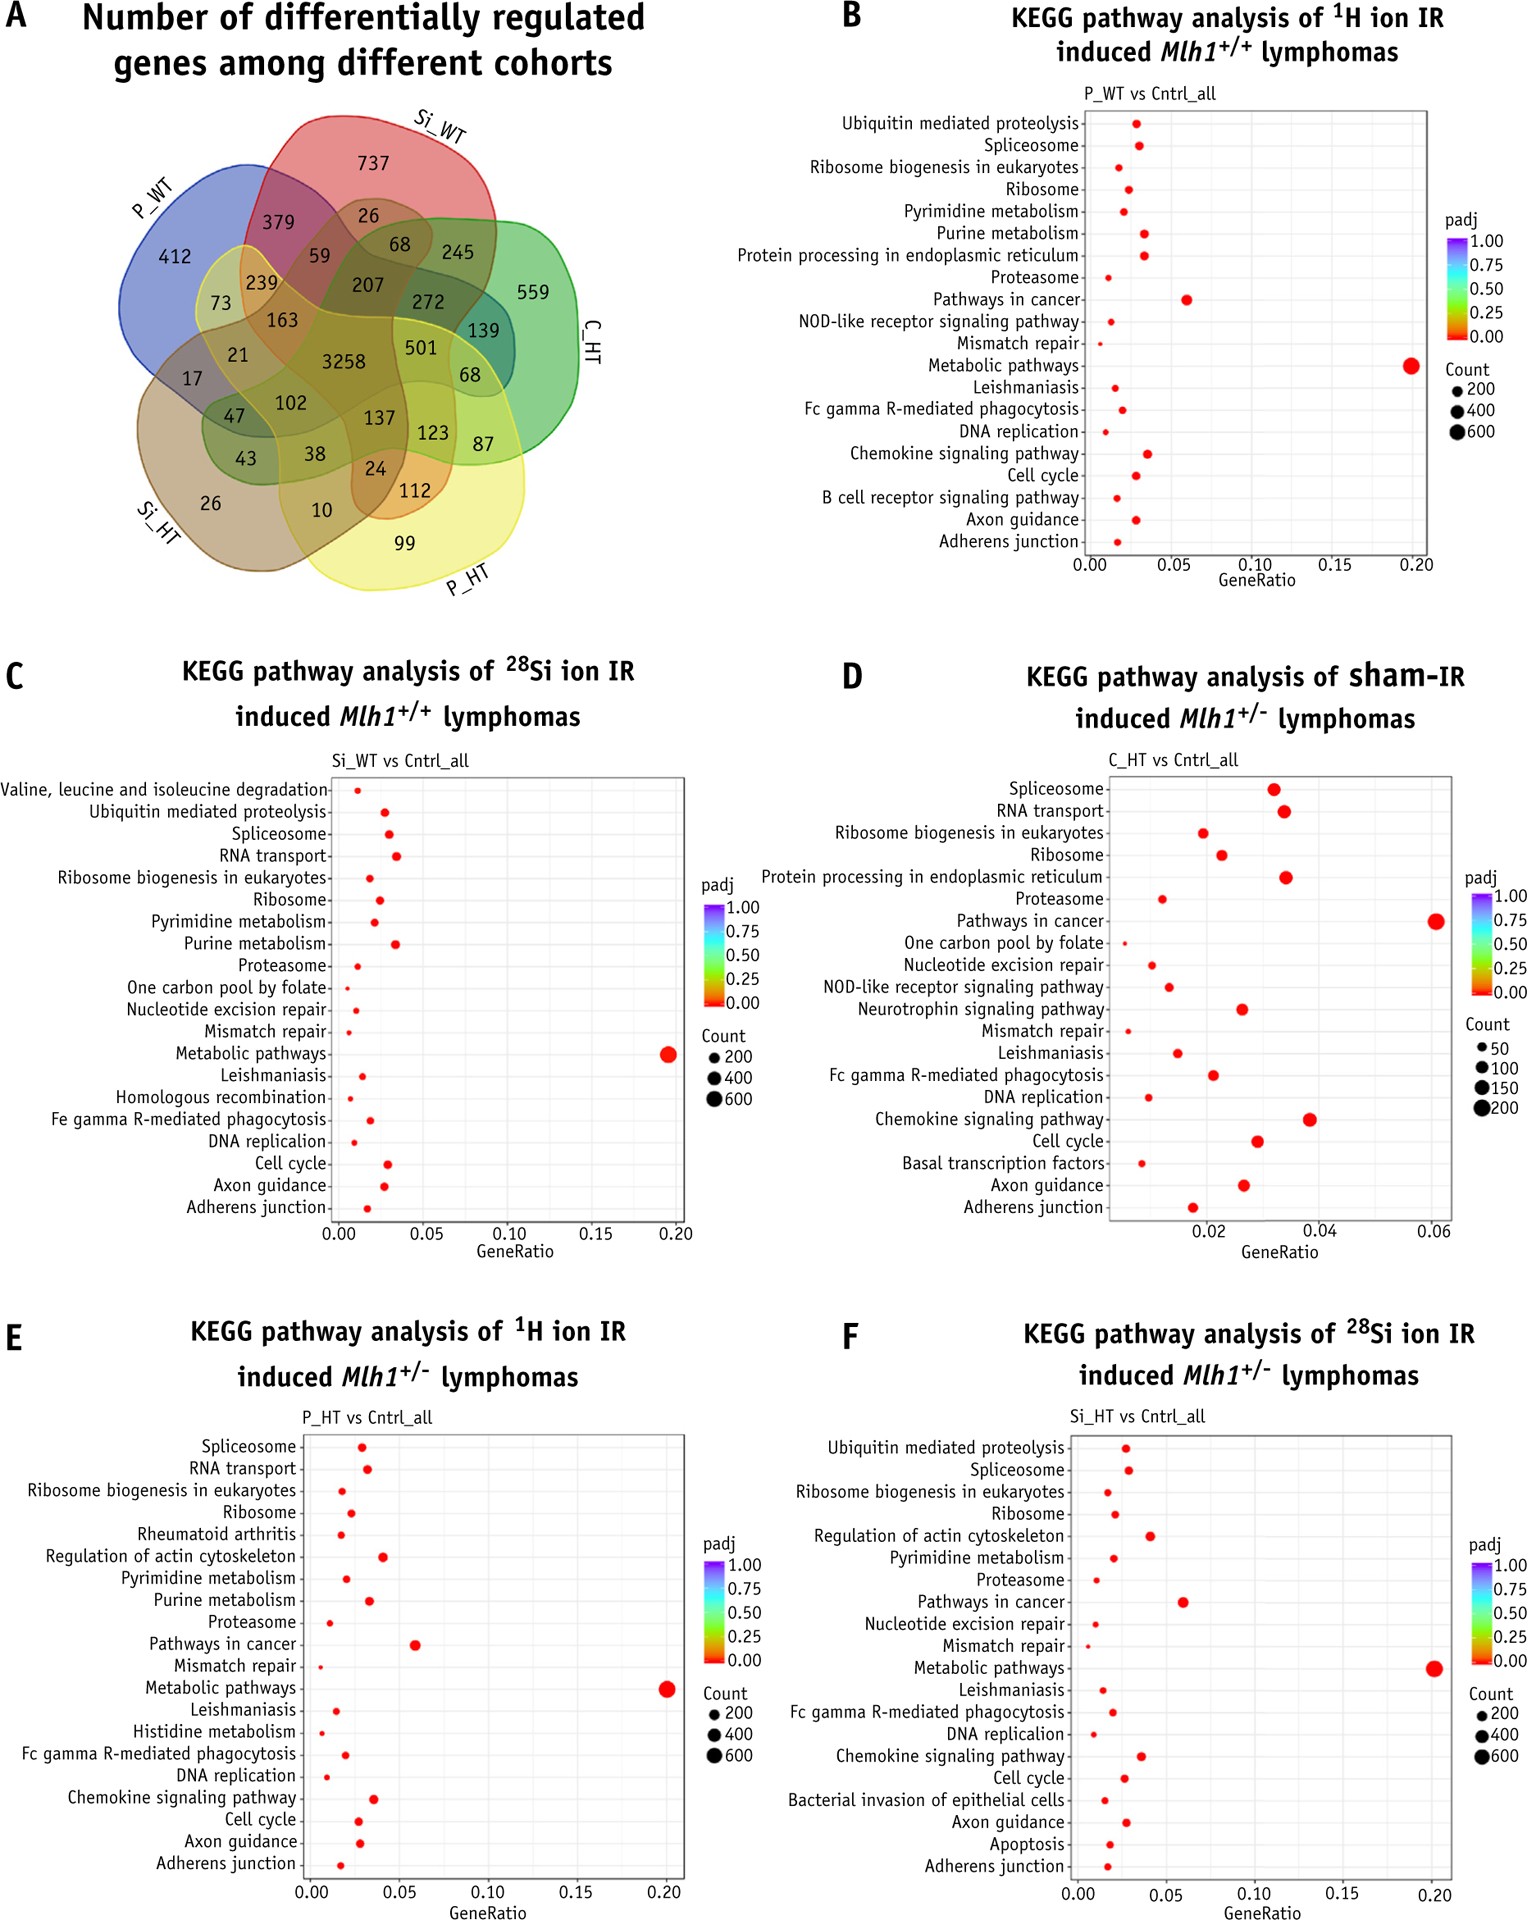
Gene ontology enrichment analysis of T-cell rich B-cell (TRB) lymphomas. (A) Venn diagram represents the number of differentially expressed genes among all Mlh1 cohorts. KEGG pathway analysis represents the top 20 pathways involved in the process of lymphomagenesis of Mlh1+/+ mice post (B) 1H ion irradiation, and (C) 28Si ion irradiation. KEGG (Kyoto Encyclopedia of Genes and Genomes) pathway analysis represents the top 20 pathways involved in the process of lymphomagenesis of Mlh1+/− mice post (D) sham irradiation (E) 1H ion irradiation, and (F) 28Si ion irradiation. Abbreviations: C_HT = sham irradiated Mlh1+/− cohort; Cntrl = control; IR = ionizing radiation; P_HT = 1H ion irradiated Mlh1+/− cohort; P_WT = 1H ion irradiated Mlh1+/+ cohort; Si_HT = 28Si ion irradiated Mlh1+/− cohort; Si_WT = 28Si ion irradiated Mlh1+/+ cohort.