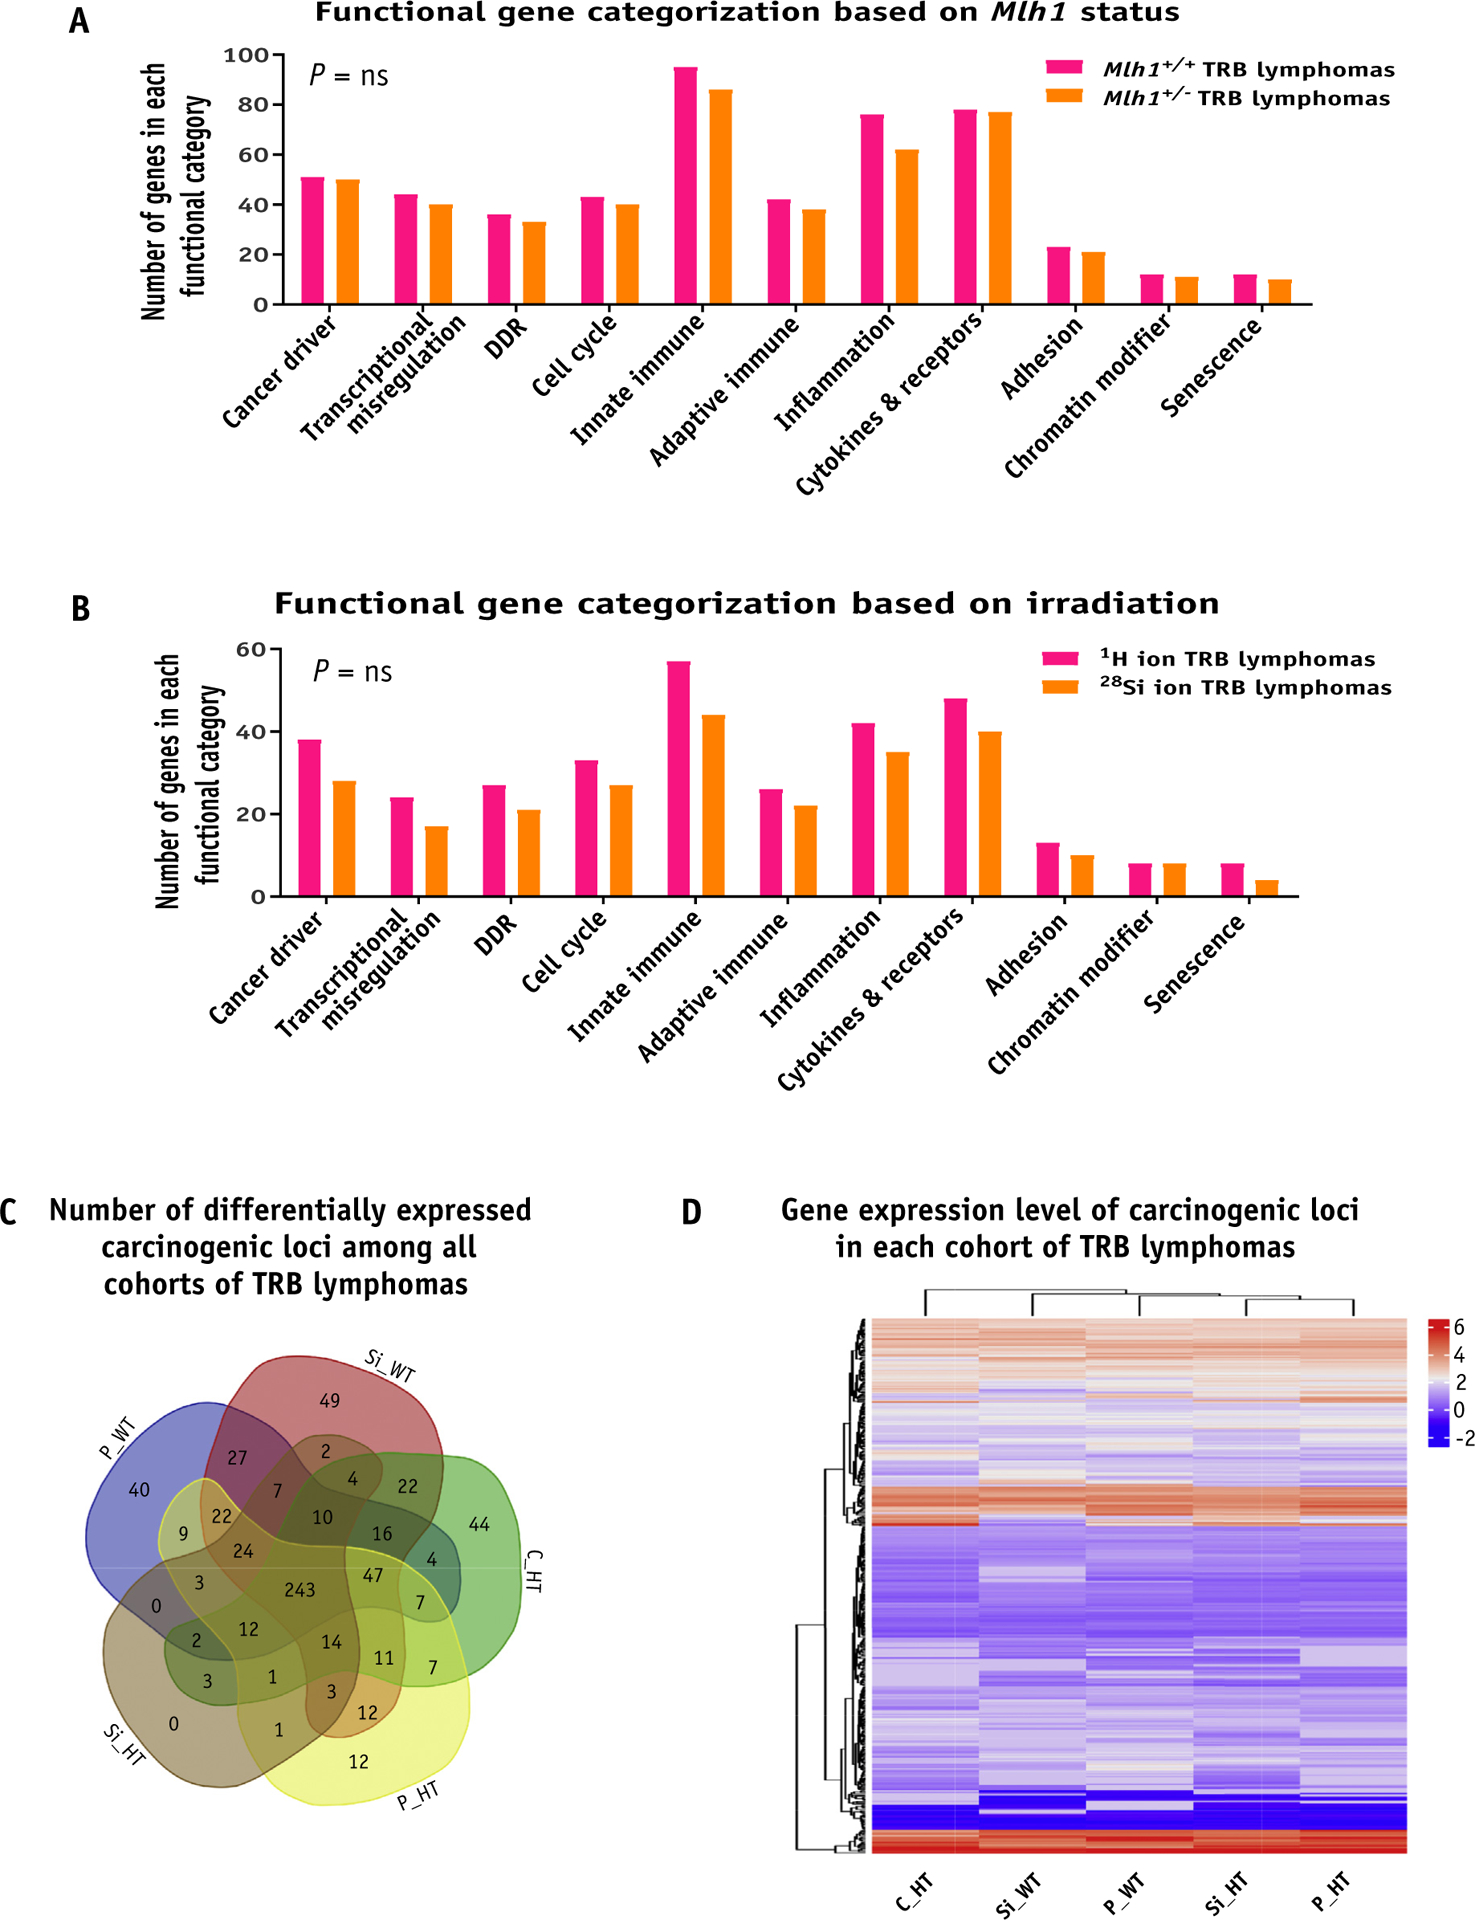
Fig. 5.

Gene expression analysis of T-cell rich B-cell (TRB) lymphomas. (A) The bar graph shows the number of genes that belong to each functional category when classified based on Mlh1 status. (B) The bar graph shows the number of genes belonging to each functional category when classified based on irradiation source. (C) Venn diagram shows the number of differentially expressed carcinogenic loci among all cohorts of TRB lymphomas. (D) Heatmap represents the gene expression level of carcinogenic loci of each TRB lymphoma cohort in the form of hierarchical clustering. Abbreviations: C_HT = sham irradiated Mlh1+/− cohort; DDR = DNA damage response; ns = nonsignificant; P_HT = 1H ion irradiated Mlh1+/− cohort; P_WT = 1H ion irradiated Mlh1+/+ cohort; Si_HT = 28Si ion irradiated Mlh1+/− cohort; Si_WT = 28Si ion irradiated Mlh1+/+ cohort; Cntrl = control. P values in bar graphs were determined by unpaired t tests.
