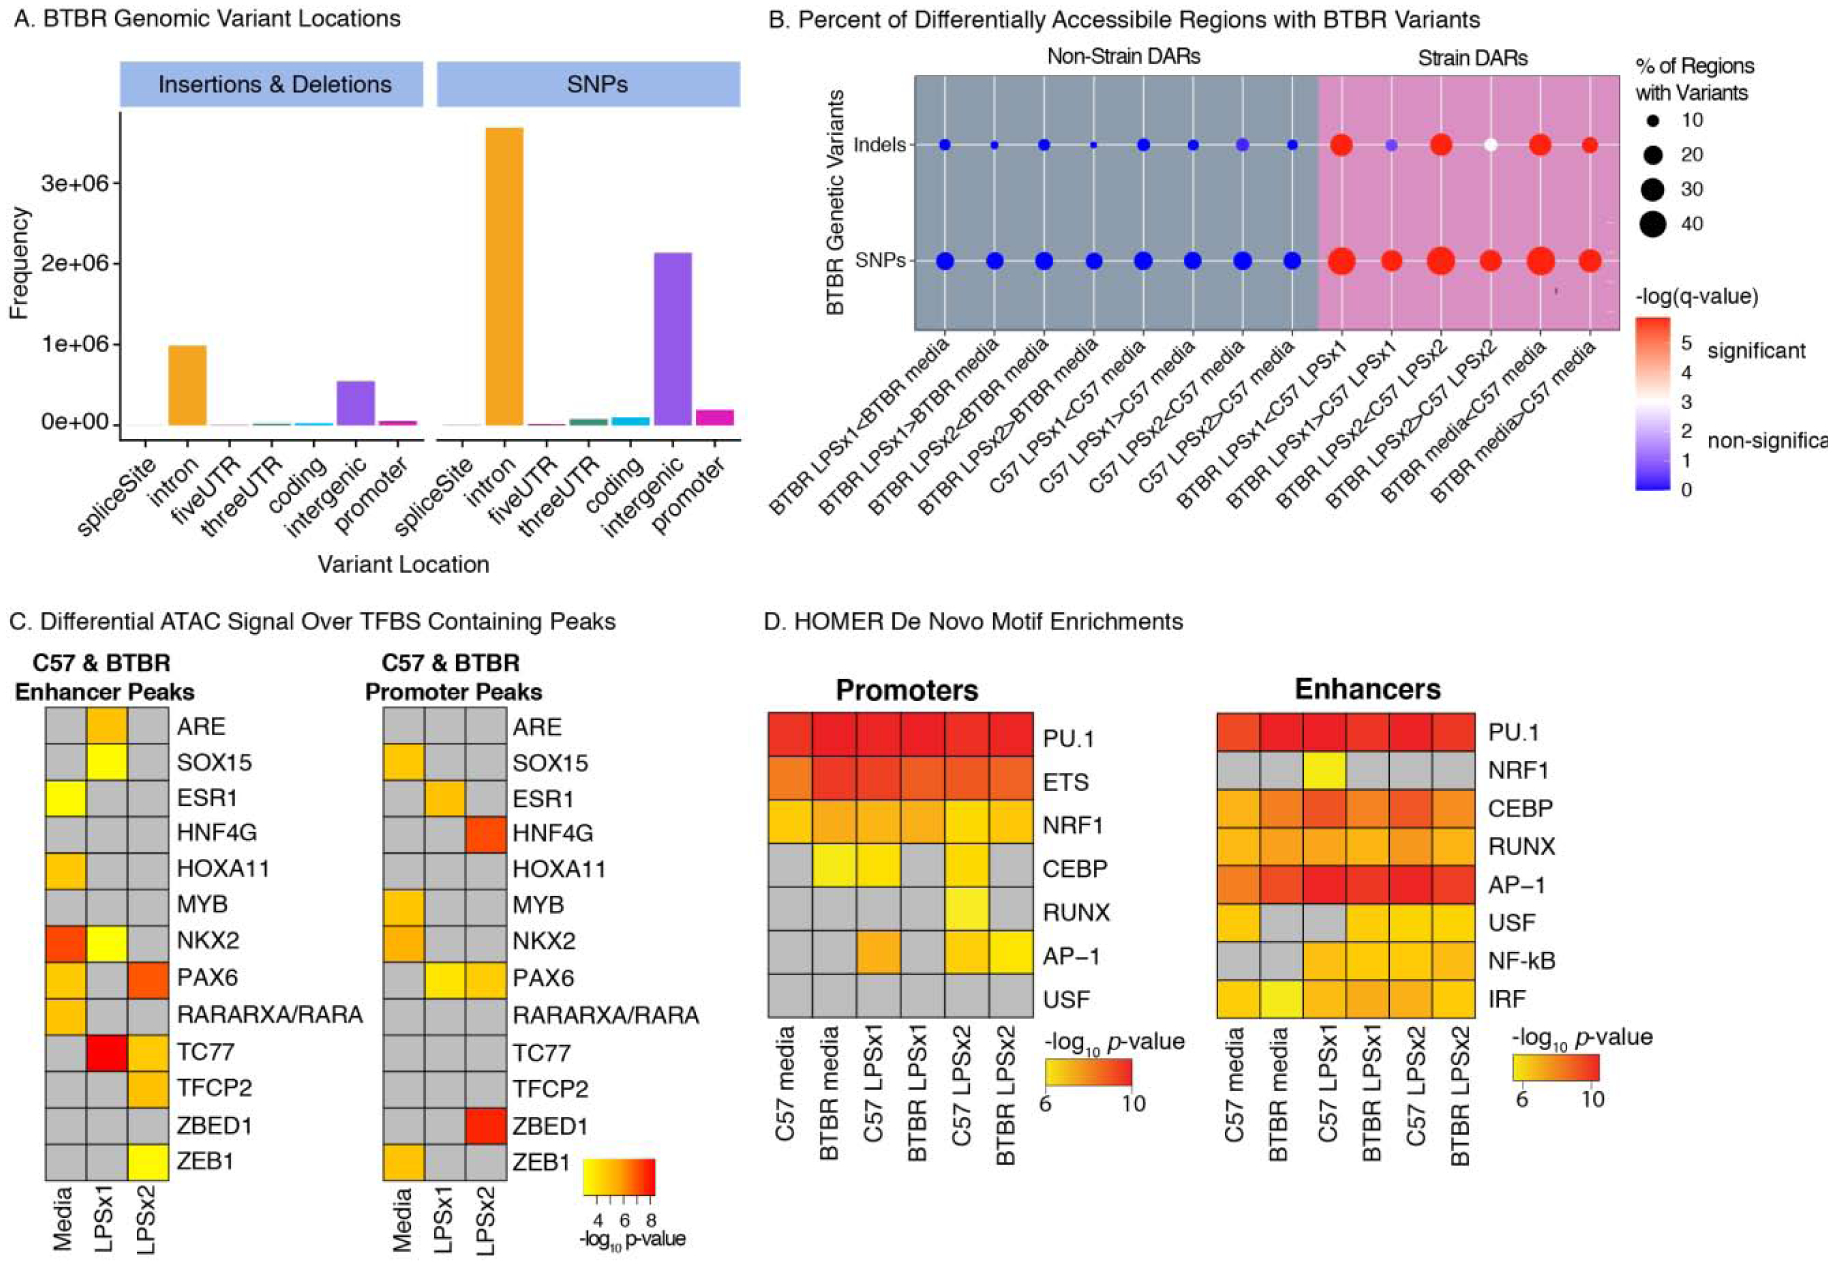
Figure 4.

BTBR Genetic Variants Impact Chromatin Accessibility and Transcription Factor Binding Sites A. BTBR Insertions and Deletions (InDels) and SNPs from the Mouse Genomes Project (https://www.sanger.ac.uk/science/data/mouse-genomes-project) occur in numerous genomic elements including introns and intergenic regions. B. Percent of DARs containing BTBR SNPs or InDels. Dots are colored by -log(FDR corrected q-value) for permutation enrichment between BTBR variant and chromatin accessibility regions (see Table S6 for statistics). Significant enrichments (q<0.05) are colored red and non-significant (q>0.05) are colored blue. Dots are sized by the percentage of regions with variants. C. MMARGE analysis results showing chromatin accessibility between strains significantly differs for peaks containing these TF binding motifs with genetic variants. Peaks were defined for each treatment condition (consensus peaks) and subdivided into promoters (< 3 kb from TSS) and enhancers (non-promoters). D. De novo motif enrichment analysis was performed with MMARGE for ATAC-seq consensus peaks of each strain and treatment condition. For C and D, significant enrichments are shown as -log10 p- values. Non-significant enrichments are in grey.
